
Break below 200 day MA and old trend line....
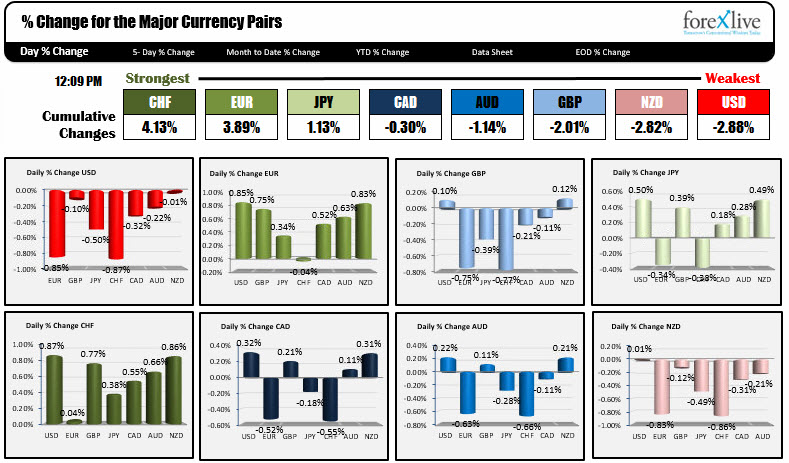
The CHF is the strongest currency of the day - rising against all the major currencies at midday. USD selling. Flight into the safety of the CHF. A technical move perhaps. The USDCHF is down -0.87%. That is the largest change of the day of all the major pairs.
What are the technicals supporting the fall in the pair (higher CHF)?
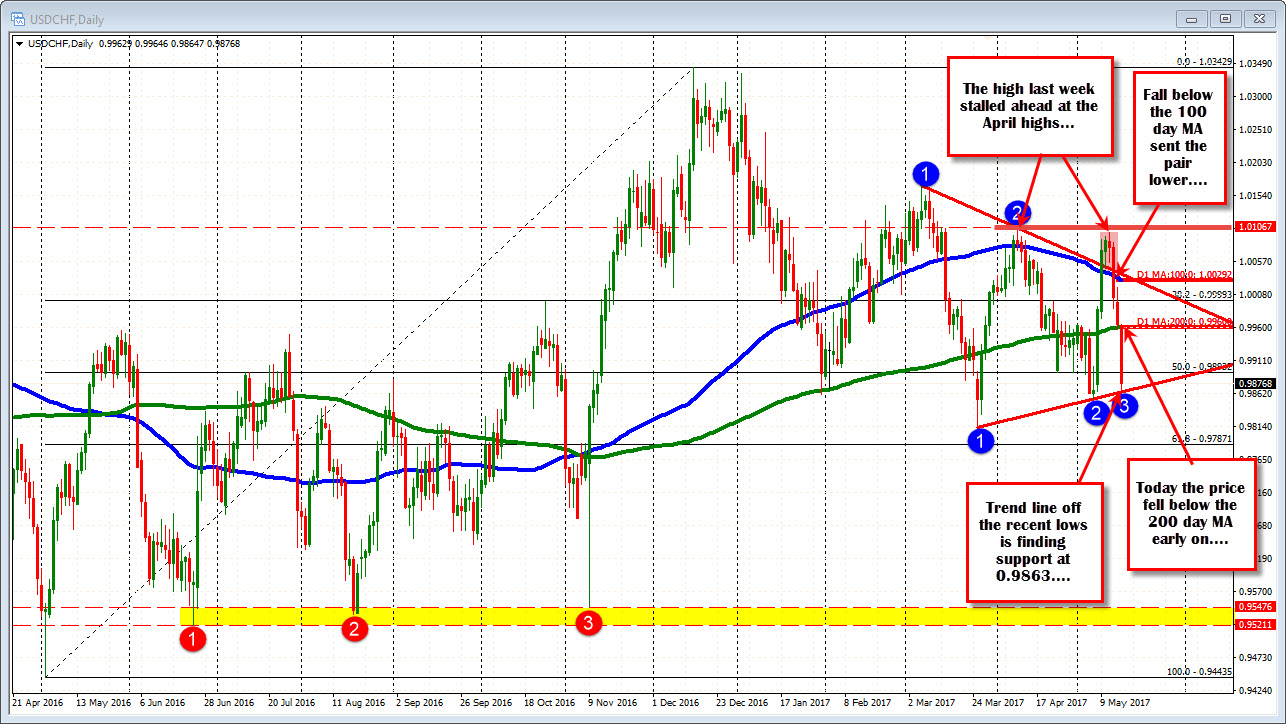
Looking at the daily chart, the price highs from last week, stalled against the April high. The price moved below the 100 day MA and broken trend line. Yesterday, the price stalled at the 200 day MA. Hold that level and the bias remains more bullish. It did not. Today, the price moved below and traded lower.
Where are we now?
The price moved to a low of 0.9864. Trend line support off the prior lows comes in at 0.9863. Traders are leaning. The range for the day is 100 pips. The 22 day average is 66 pips (around a month of trading). The range is extended. Buyers may be willing to take some profit into the NY afternoon session. Risk can be defined and limited against the target level. A move below and the buyers may think twice about the buy (they will likely use the May 4 low at 0.9855 as the stop though).
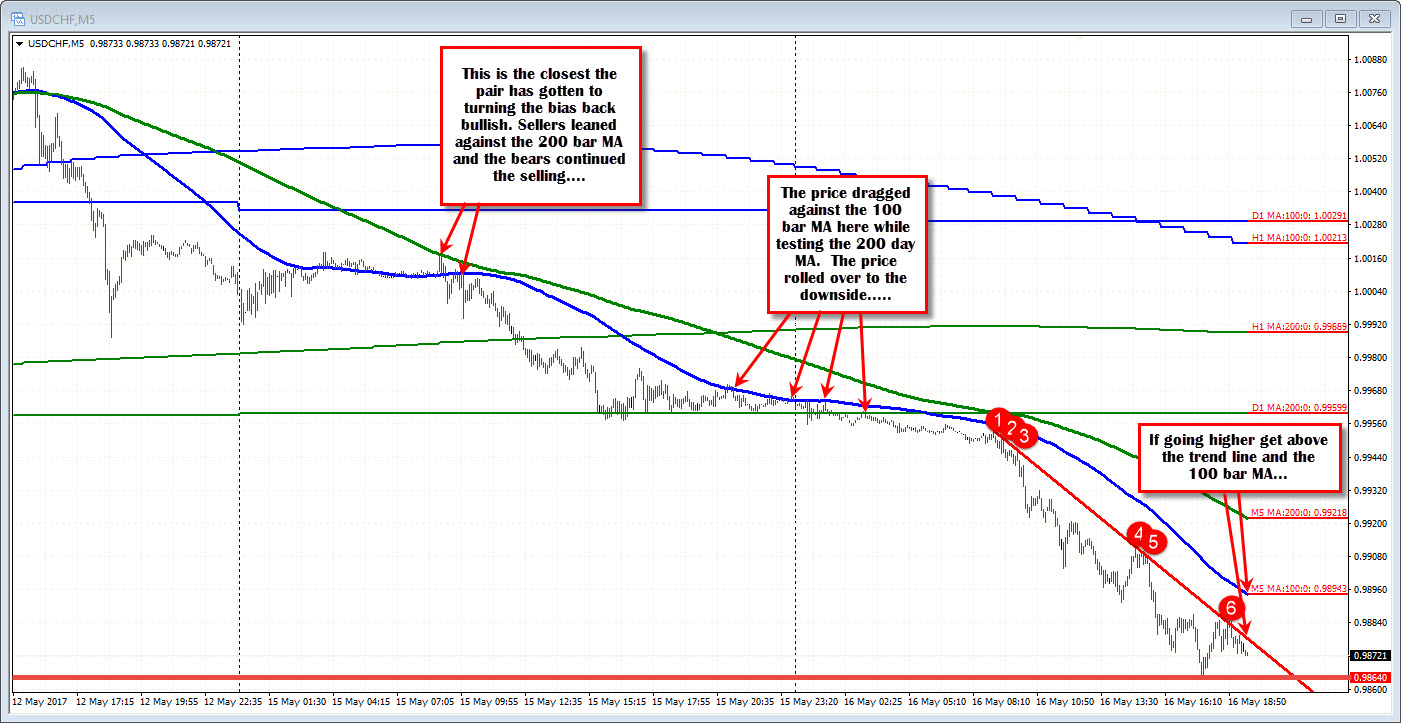
Drilling down to the 5 minute chart, the market has been trending since May 12th. The price has not traded above the 200 bar MA on that chart, since that day (green smooth line). You can also see the price action around the other MAs like the 100 hour MA, 200 hour MA, 100 day MA and the 200 day MA (all overlayed on the chart). The market has been paying attention to those MA lines and used them to define the bearish bias.
Today, the price started near the 200 day MA and the 100 bar MA on the 5-minute, When the price started trading more below the lines in the Asian session, more selling showed up. The selling intensified in the European session.
What now?
We know there is support at the 0.9855-64 area from the daily chart. If that holds, room for a correction off the oversold conditions and key support. What would give dip buyers satisfaction?
Getting above the trend line that connects highs today AND then the 100 bar MA on the 5-minute chart at 0.9894 (and moving higher). That would be the steps in the bullish direction that would give buyers some breathing room. From there traders will look more toward the 200 bar MA on the 5-minute chart (at 0.99214 and moving lower).
Summary, it is hard to not see the bearish in the USDCHF, BUT there is ceratainly a cause for pause at the 0.9855-64 area and I expect buyers to show up. How far that correction go will be dependent on the topside targets. The trend line on the 5-minute chart and the 100 bar MA on the same chart at 0.9894 (and moving lower) are the hurdles to get to and through. If they can be breached a further move toward the 200 bar MA could be in the cards. ON a break below the 0.9855, the March 2017 low at 0.9812 becomes the next target.

