
Moves back above 100 day MA
The USDCAD has stretched to new session highs and in the process has moved back above the 100 day MA (blue line in the chart above).
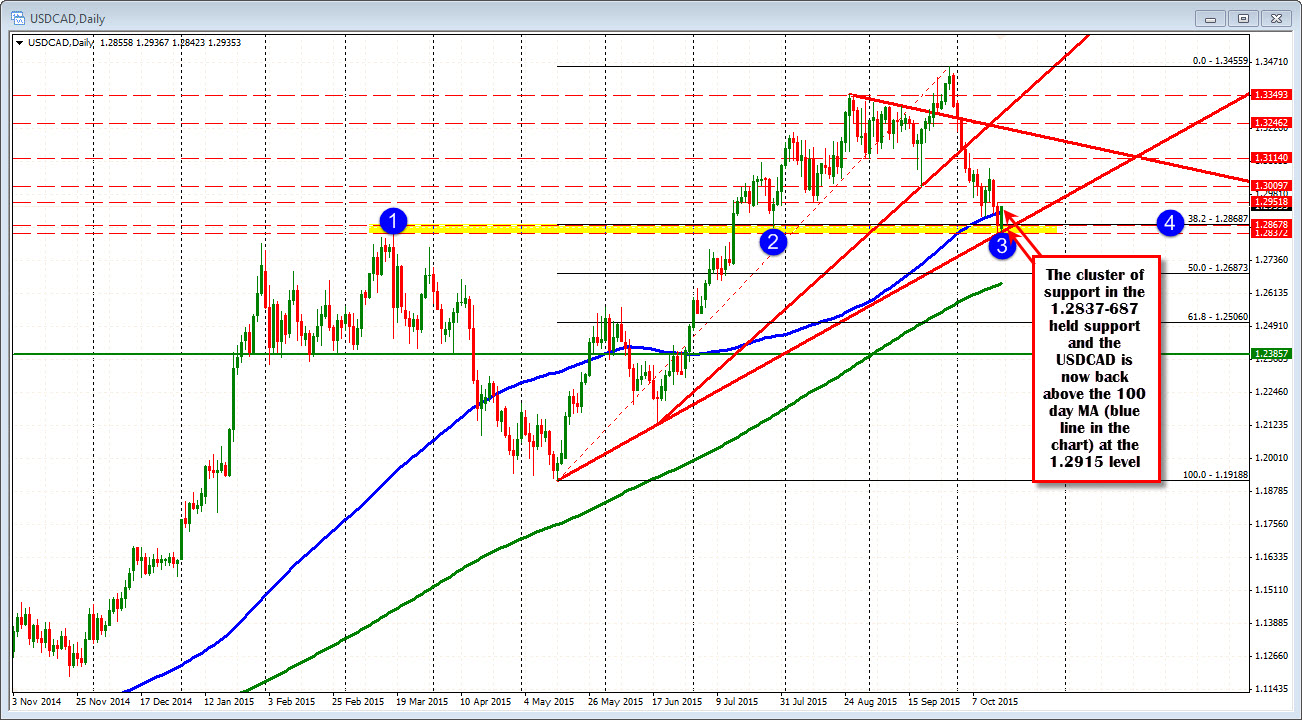
At the lows today, trend line support (blue circle 3) the swing high from March/swing low from July((1 and 2 in the chart below), AND the 38.2% of the move up from May (4 blue circle), all held the line/support.
So buyers sniffed, stuck a toe in the water against support, and are trying to make a play on a bottom being in place with the confirmation move back above the 100 day moving average at the 1.2915 level.
It is Friday. The market is subject to the illiquid swings, but what was defined this week (at the least) is that there are was a test of key support and it held. Next week, that area may be tested again and if so, traders will have a risk defining level to lean against or trade through. Right now, as we sit, the buyers are starting to take back some control above the 100 day MA.

