Traders leaning...
The USDCAD shot up on Tuesday and continued that climb in trading yesterday. The price action today is more corrective. Key resistance seems to giving traders cause for pause.
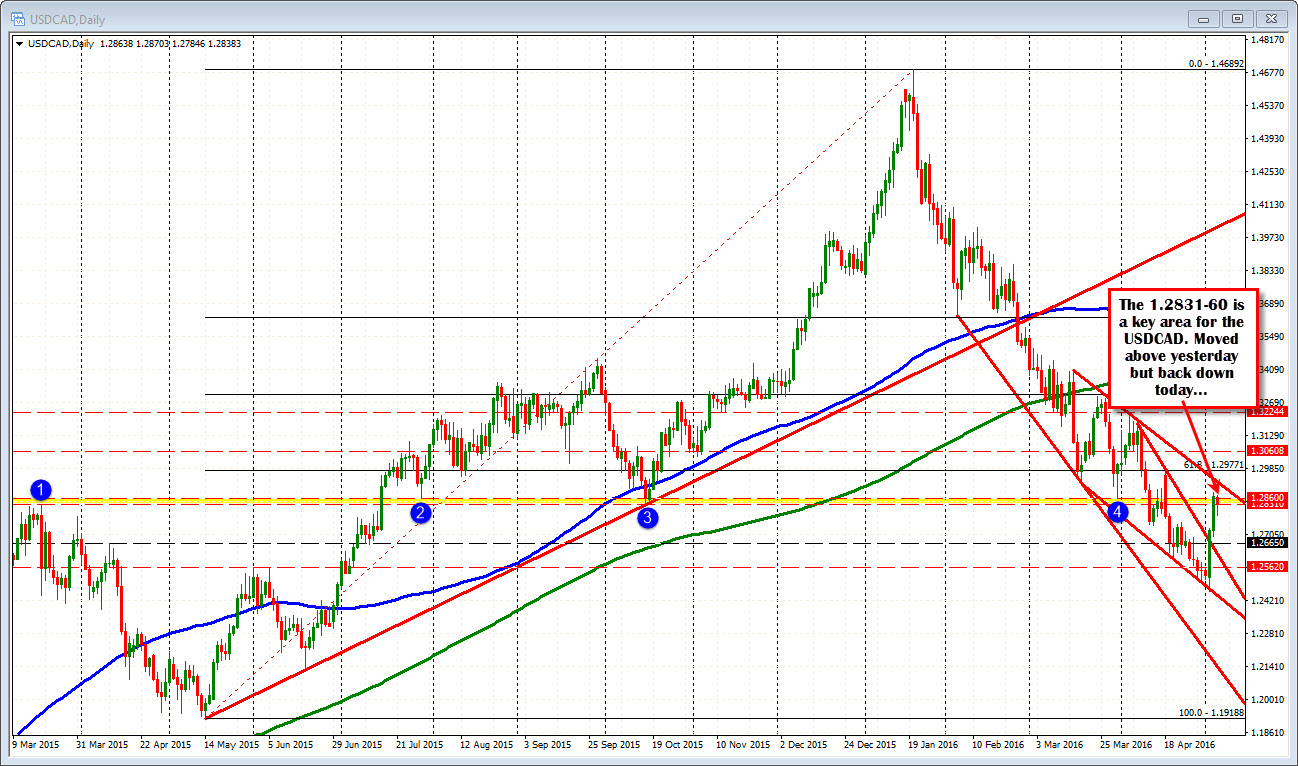
Looking at the daily chart, the price has a key topside resistance at the 1.2831-60 area. The area corresponds with prior major swing lows and highs going back to March 2015 (see yellow area and blue circles in the chart above). The price for the pair did extend above that are yesterday - the high reached 1.28845 - but has backed off and trades in that yellow area.
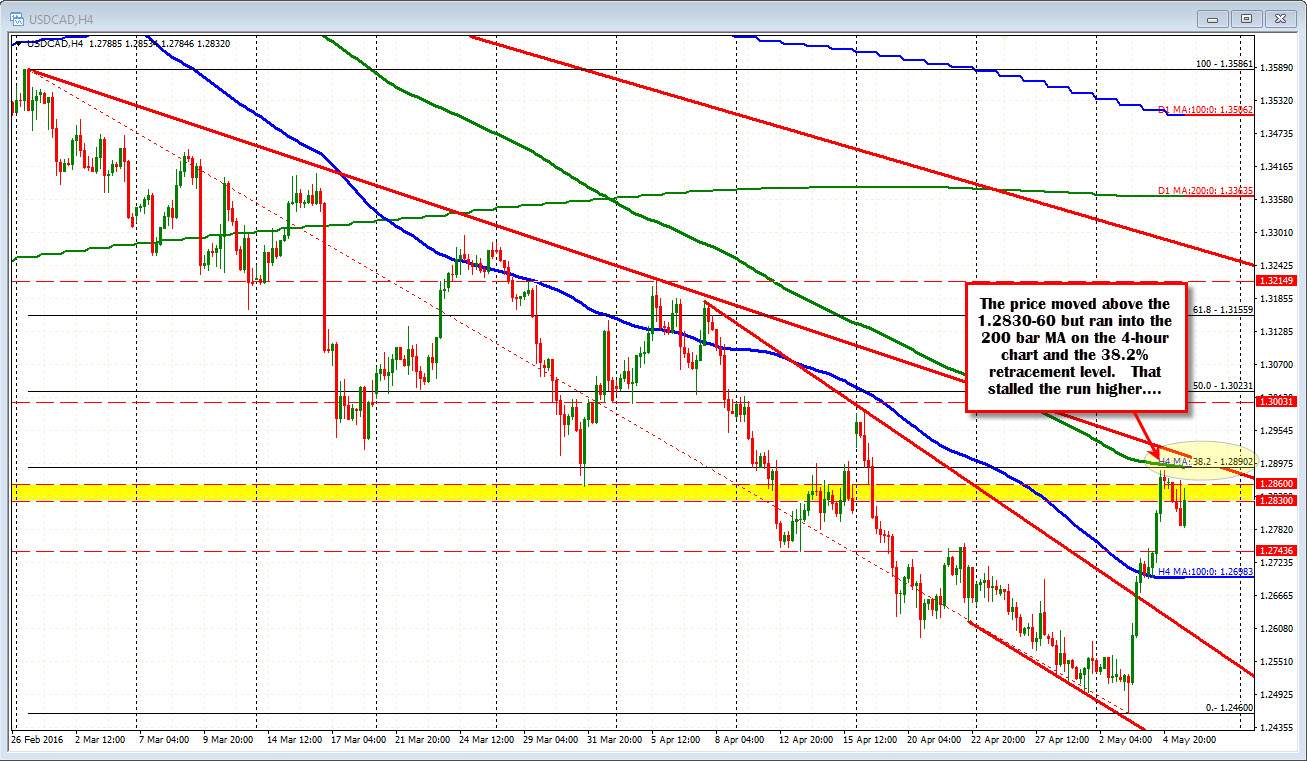
The 4 hour chart tells the reason for the selling above.
Looking at it, the price rise breaks above the aforementioned resistance off the daily chart, BUT runs into the 38.2% and the 200 bar MA on the 4-hour chart. That stalled the rise and the price corrected lower.
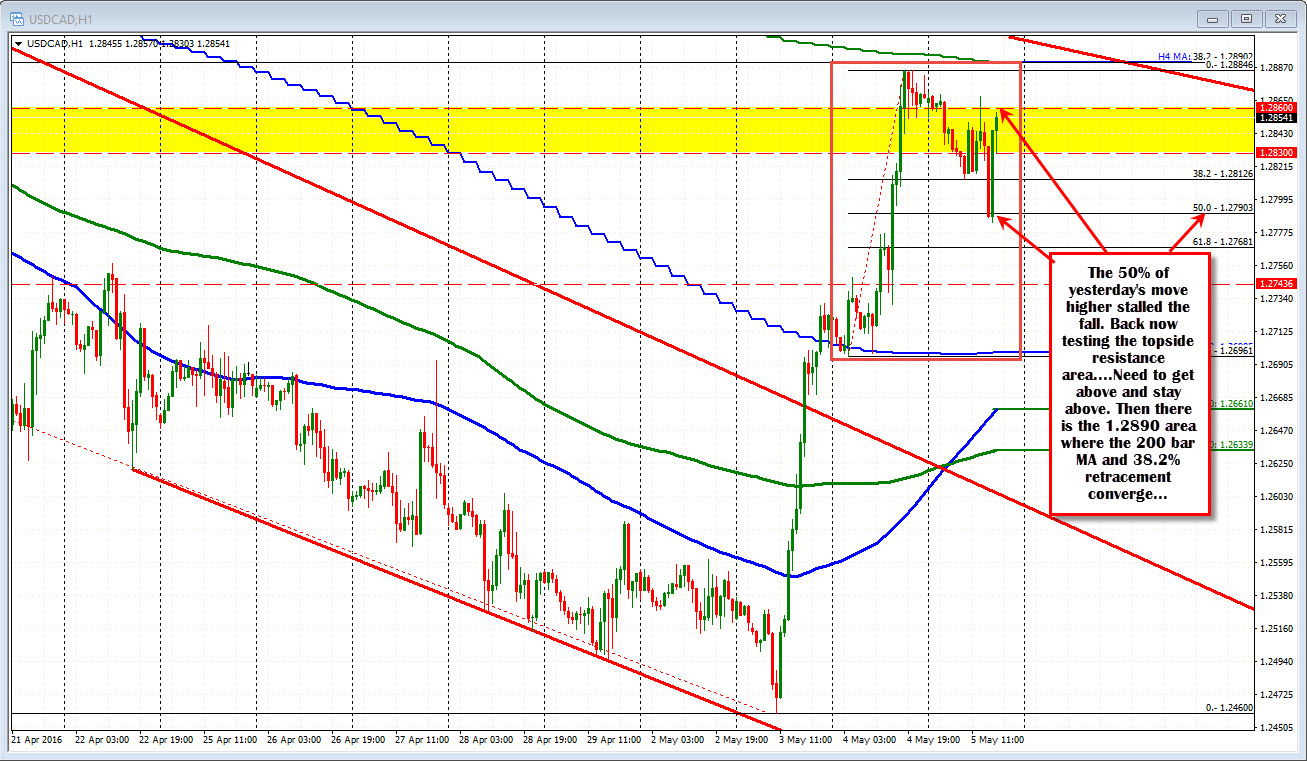
What now? Well the price action today is down but also quite volatile. Looking at the 1 hour chart below, the corrective move stalled around the 50% retracement on the move lower today. Oil prices are up today helping the downside (higher CAD) - at least initially. We are now seeing a bounce back in the key yellow area from the daily. If the price can get back above the 1.2860 level - and stay above - a retest of the overhead key resistance seems logical, but it remains a tough nut. All eyes on the levels.