
Overhead resistance looms
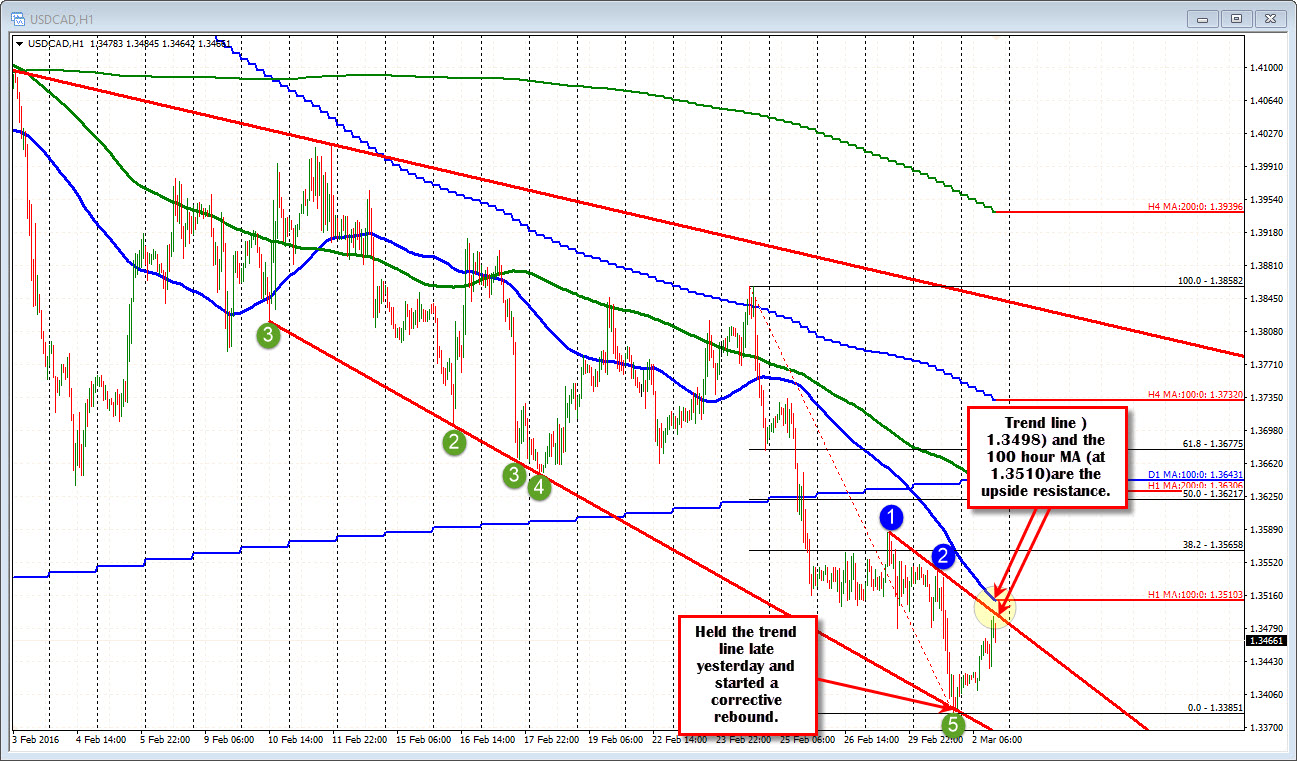
The USDCAD has rebounded off of trend line support that held late yesterday. Looking at the hourly chart, the pair has climbed toward a close trend line at the 1.3498 level. The 100 hour MA comes in at 1.3510. Traders will need to see a break above (and stay above) to shake some of the bearish cobwebs off the pair.
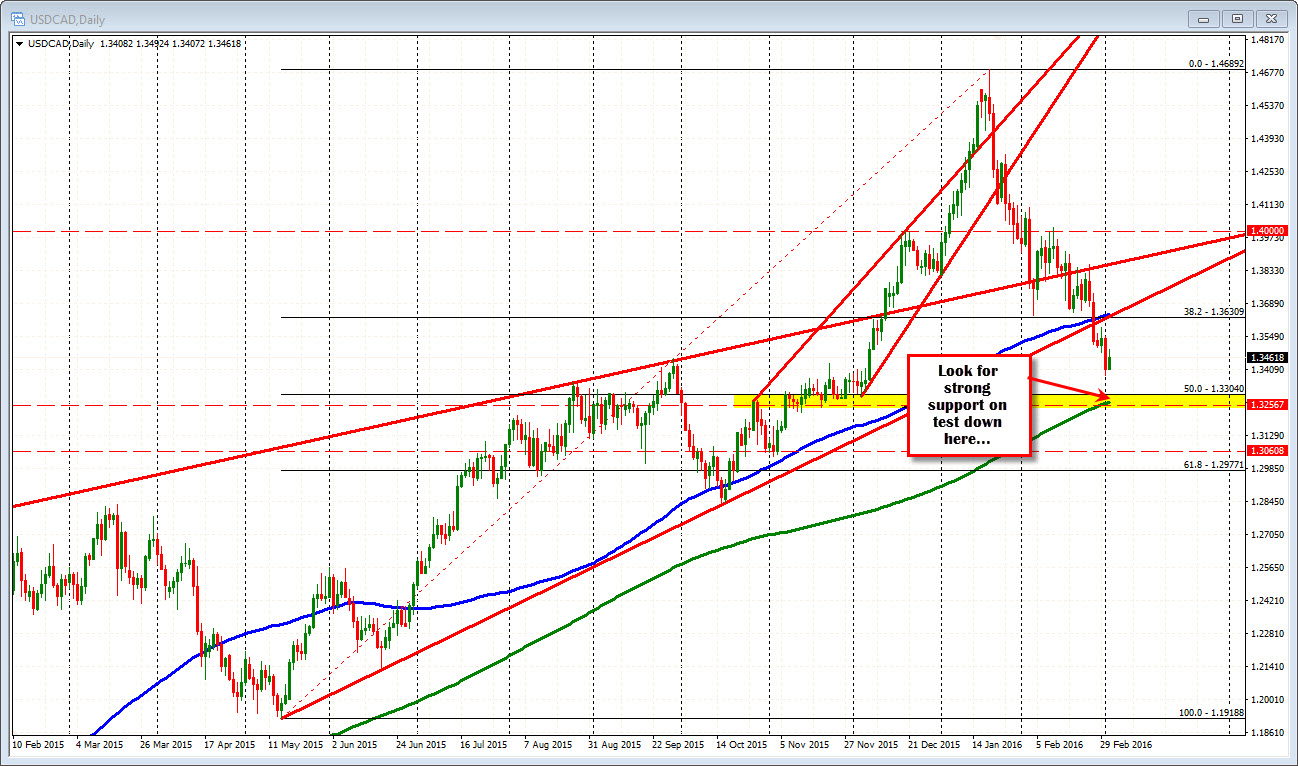
Looking at the daily chart, the 50% of the move up from the May 2015 low is being approached at the 1.3304 level. And below that is the 200 day MA at the 1.3263 level. That area should be really strong support on a test. Be aware. The pair broke below the 100 day MA last week and has remained below it (and broken trend line) since that break.
The oil inventory data is out at 10:30 AM ET. Oil is trading at 34.27 down -0.38%. The low was $33.53. The high has extended to $34.40 today.

