
Below 100 hour MA at 1.3827
The USDCAD is moving back toward the lows for the day (or so it seems) at the 1.3785 level.
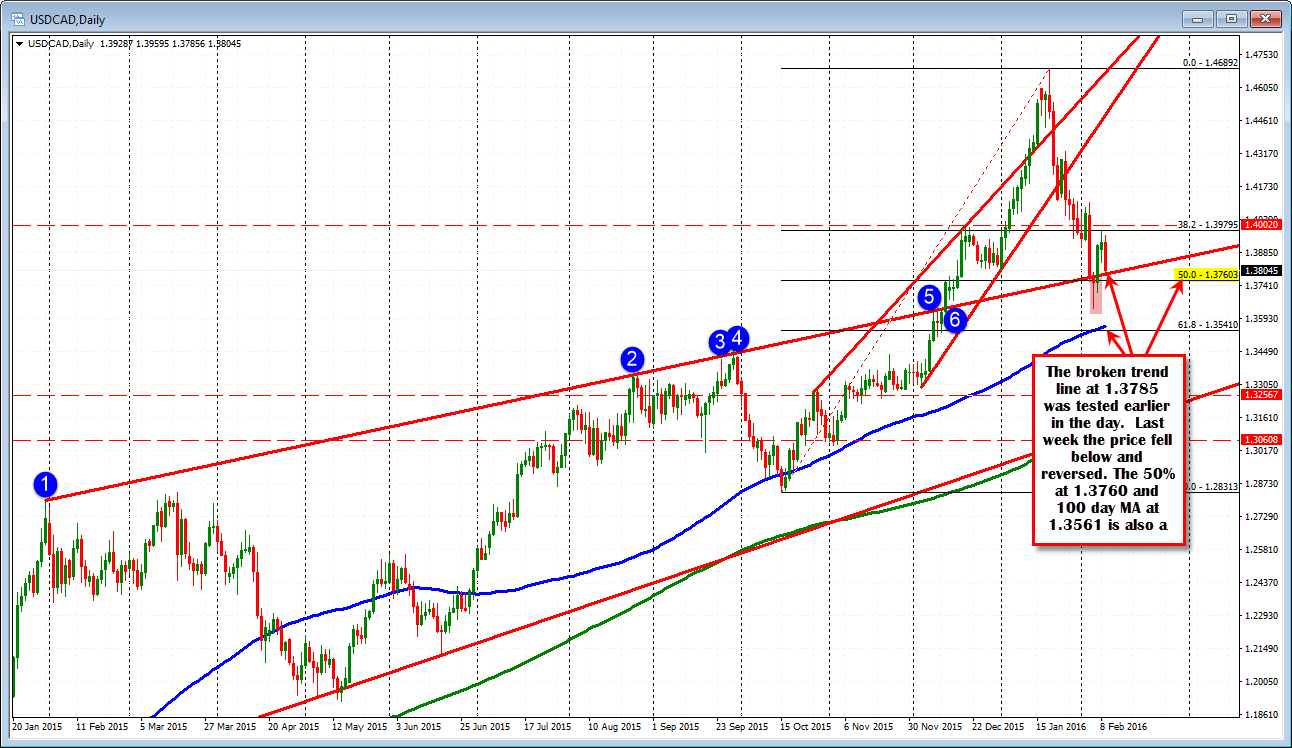
The low tested a broken trend line going back to Jan 2015 (see daily chart above). The price moved above that line in December. Last week it was broken but that break failed. The low today seemed to attract buyers on the old line.
Below that the 50% retracement of the move up from the October low comes in at 1.37603. The 100 day MA - blue line in the chart above) comes in at 1.3561. There have been only two closes below the 100 day MA going back to the end of June 2015.
For the time being though, the buyers seem to be trying to hold the support line.
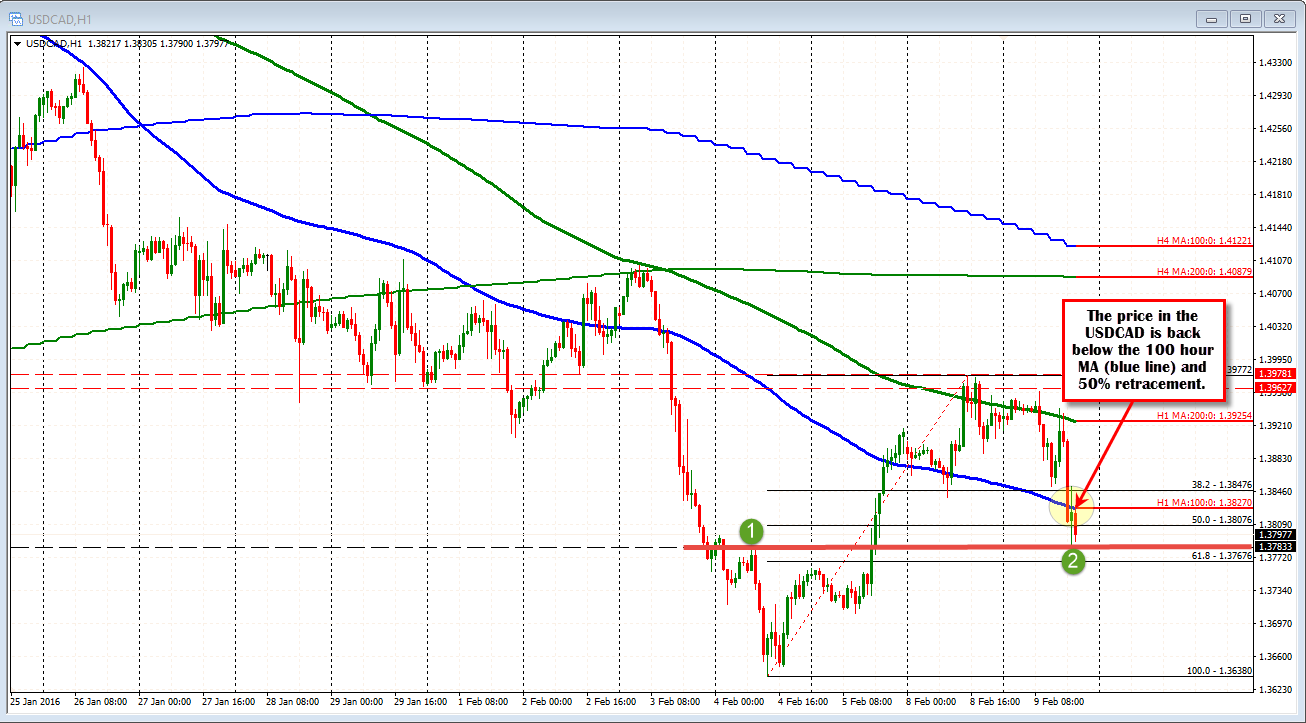
Looking at the hourly chart, there is a little bullish but honestly more bearish. The price has moved below the 100 hour MA at the 1.3827 level currently ( blue line in the chart below). The price is also below the 50% retracement of the move up from last week's low. That level comes in at 1.38076 currently. The only positive is that the corrective high on Feb 4 held support. I am really grasping though as it ain't that great a level. So overall, the nod goes to shorts on the hourly chart. What would turn things around? A move back above the 100 hour MA at the 1.3827. A closer clue might be the 50% level, but the last two hourly bars have been above and below that level already. As a result, it may not be that important.
Crude oil prices are trading near low levels at $2937. The low came in at $29.29. The high has extended to $30.64. Inventory data will be eyed closely. Last week there was a huge increase. The fall in crude from the high does not support the fall in the USDCAD (the rise in the CAD). We still need to see that those aforementioned levels retaken (at 1.3807 and 1.3827)to get the technical picture more bullish.

