
Buyers stall the fall at the 50%
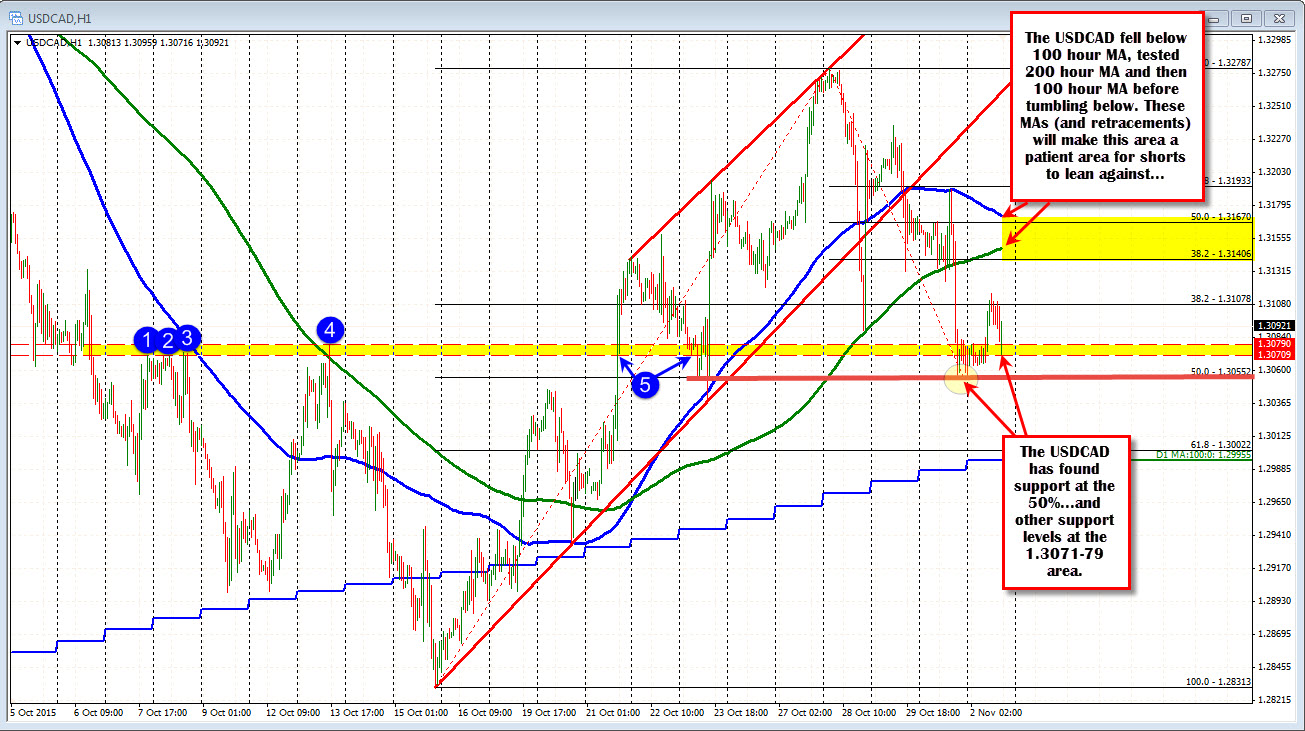
The USDCAD fell sharply on Friday but stopped right at the 50% of the move up from the October 15 low (see chart below).
Today, the Asia-Pacific session saw the price test the level on the opening, but for the most part, move sideways in a narrow trading range. In the London morning session, there was a rally higher that stalled. The subsequent fall is finding support ahead of the day's lows and we are seeing a move back toward the 1.3100 level at the moment Oil prices are down $0.14 on the day. Kind of random up and down action today it seems.
On the downside from a technical perspective, the holding of the 50% is shaping up as an important line in the sand for traders as the new week begins.
Meanwhile, on the topside, the 200 hour MA (green line in the chart above) was broken on Friday and ran (the 2nd time at least). That MA is currently at 1.3148, and will be an important target on the topside this week should the support at the 50% hold the line. It is also looking to be on a collision course with the 100 hour MA which is at 1.3171 currently (and moving lower). Be on the lookout for patient sellers on the 1st look against that area (between the 200 and 100 hour MAs).
Technically, there is a case for the price to move higher. There is also a case for rallies to be sold (broke 100 hour MA, trend line and 200 hour MA on Thursday and Friday). We are currently off support and below resistance. I think traders can play the range and look for a break of either extreme.
For the week, fundamentally, we get trade balance on Wednesday, Ivey PMI on Thursday and the employment statistics on Friday (along with US Employment). So there is some fundamental catalysts. Oil prices will also be eyed (as usual).
Technicallly, there

