
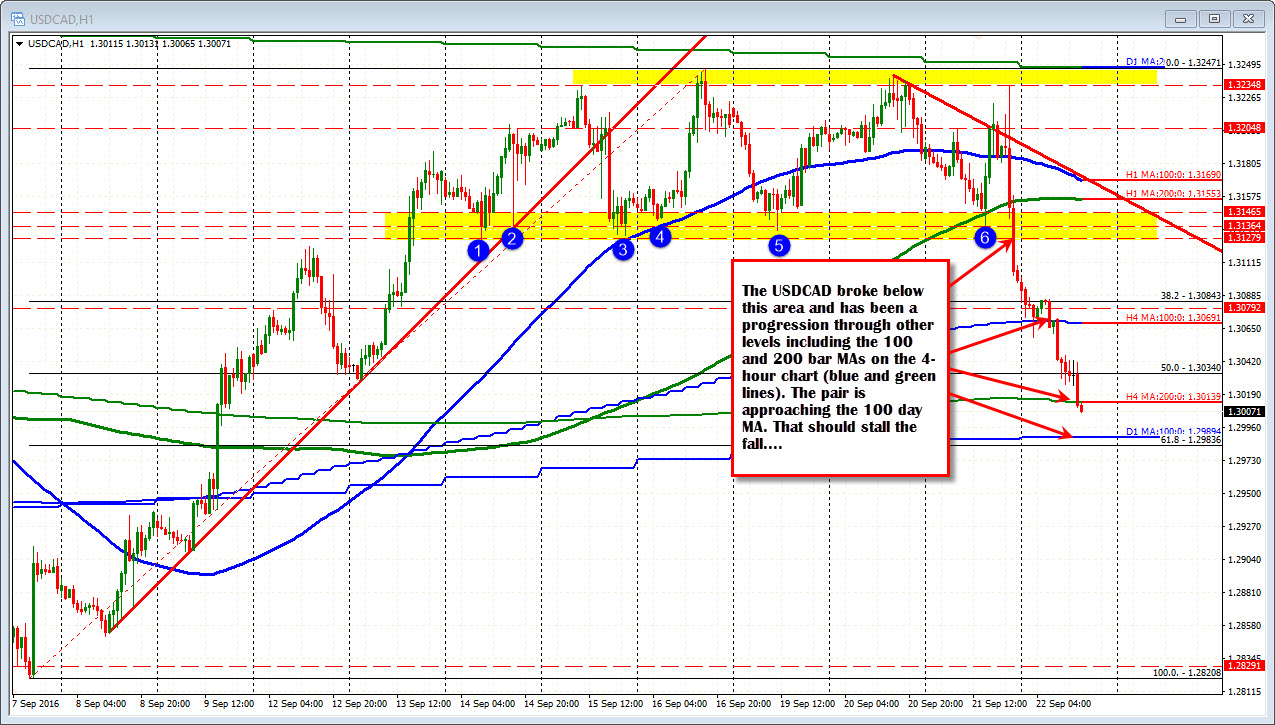
The pair has been on a downward trajectory since breaking below floor yesterday
The USDCAD is looking to test it's 100 day MA at the 1.29894 level. The 61.8% of the move higher from the September 7th low is not far away from that level at the 1.29836 level. The combination should be supportive to the pair on the first test with stops on a break below.
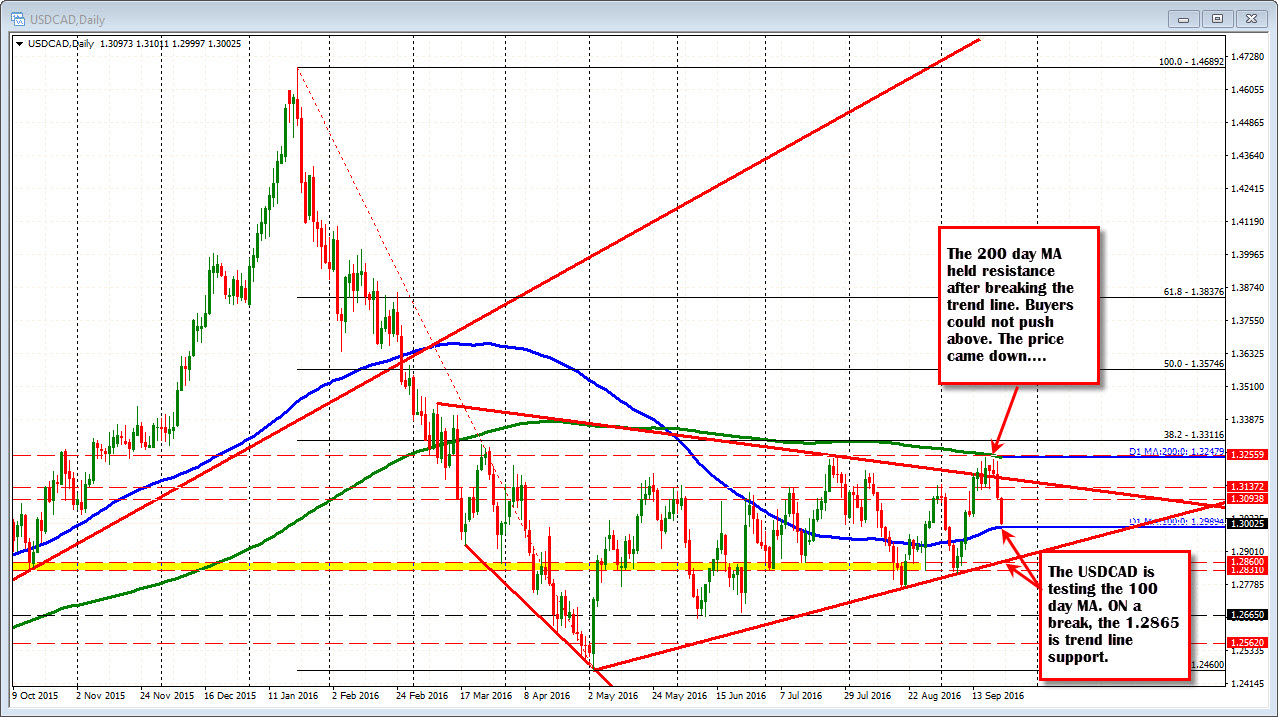
Looking at the daily chart, the USDCAD remains confined by technical levels above and below. At the recent highs, the price was able to get above a topside trend line but stalled just ahead of the 200 day MA (green line in the chart below). That level currently comes in at 1.32479 (the high reached 1.3247). On the downside the 100 day MA gets in the and below that a lower trend line connecting the lows in May, August and September. That line cuts across at 1.2865. The 1.2831-60 is also a support area.
Crude oil prices are helping the move lower with the October futures contract tradinga t $46.24 up 1.99%.

