
If it can't go lower, it will go higher.
The USDCAD has been up every trading day this calendar year. This is trading day 13. The price closed yesterday at 1.4577. Wow. The close on Dec 31 was at 1.3830. The high reached today extended to 1.4689.
In a few minutes the BOC will announce there interest rate decision (see Adam's posts). Do they cut? Do they wait? Oil is down sharply but the weaker CAD should be doing some cutting for them. Much will depend on what they do and what Poloz says.
Technically, the theme is if it can not go lower, it will go higher. For 12 days it has gone higher so the close from yesterday will be a level to eye on any move lower. That level comes in at 1.4577. A move below that and the sellers take back some control. They have a win after 12 straight defeats.
What are the other levels below that would signal, more corrective weakness (i.e. sell the fact type trading).
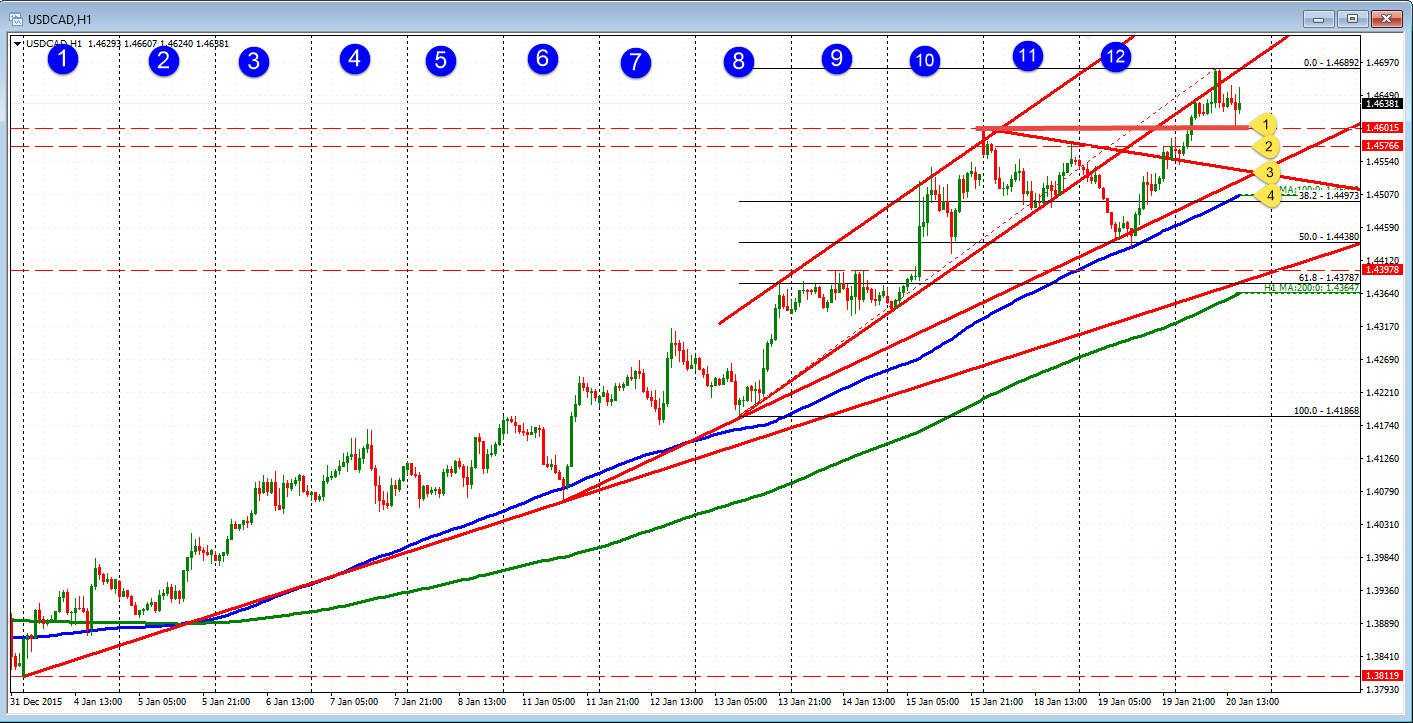
Here are my downside levels and why's
- 1.4601. High from January 18. The low reached reached last hour got down to 1 4606 and bounced.
- 1.4577. This is the close from yesterday. A move below and staying below, would break the string of 12 consecutive up days. That should be a clue that the corrective action can continue.
- 1.4535. There is a broken down trendline and a rising trendline that comes around this level.
- 1.4497 – 05. The 38.2% retracement and 100 hour moving average
Those are the levels that if the price is going lower, should be the roadmap for a bigger correction in that direction. Remember 12 days in a row higher require the sellers to prove they can take some control back. If they cannot, they are not winning. The buyers are still in control and the price can still go higher.
ON the topside, if you can go lower, it will go higher. A break above the 1.4689 will open the door for further upside potential. In which case a failure will be the thing to eye (i.e., a move above 1.4689, and a quick move back below). Absent that and let the trend higher continue. Is 1.5000 a target? Wow!

