
US Unemployment report released at 8:30 AM ET
The US employment report report for the month of January will be released at 8:30 AM ET. All you need to know about it from a fundamental perspective you can find HERE.
Technically, traders are REALLY waiting for it. The EURUSD is in a 34 pip trading range - barely moving. The past two days have done all work for the pair up to this point.
Of course no one knows the number, or the market impact. We can estimate it at 190K but last month had similar estimates and there was a 292K number with a +50 revision. So you have to prepared for each scenario.
ON the topside what levels are key for bulls and why. Admittedly, the pair broke to the downside back in October and that move was a quick tumble. There is little technical levels left in it's wake. The market this week trended higher leaving dust in it's wake. So there is little in the way of upside resistance. Nevertheless, here are the targets I am looking for on a weaker number (<150Kish)
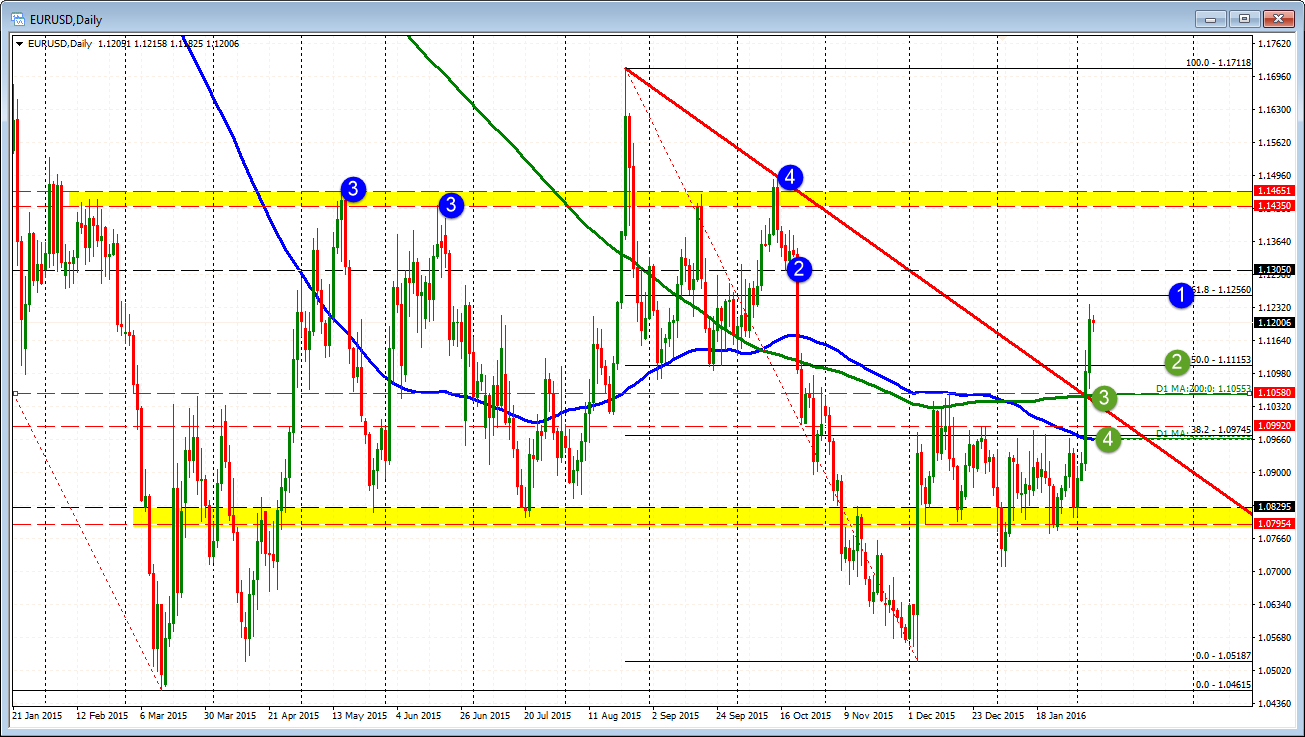
- 1.1256. The 61.8% of the move down comes form the August high
- 1.1305. Go back to October 19-22, this level was a low. Then the level was breached on October 22nd, and the market tumbled
- 1.1435-65. Looking at the highs going back to February 2015, those highs stalled the pair in Jan 2015, April 2015, June 2015 and September 2015.
- 1.1494: The high from October 2015
Can we get to the 1.1435 area? It would imply a move of about 250 pips. Can we do that? sure. Non trending leads to trending and we trended into this number. Please note that there is little in the way of resistance between 1.1305 and 1.1435. That does not mean there will not be other levels to follow, but it will develop as the market moved via what is happening on shorter term charts (even the 5-minute chart). The market looks for levels and they will develop.
ON the downside it is a bit easier as there are levels from where we just came:
- 1.1153-73. This is the close support. It is represented by the 38.2-50% of the move up from yesterday's low.The trend line connecting most recent highs slice through the level.
- 1.1115: This is the 50% retracement of the move down form the August 2015 high
- 1.1042- 1.1055. This is the 200 day MA. A move to this level today would imply a range for the day of 164-80 pips. That is clearly doable
- 1.0992-1.10000: Just because
- 1.0967: 100 day MA
Be smart. Risk is increased. The bulls are charged up.

