First close above 100 hour MA since August 24th
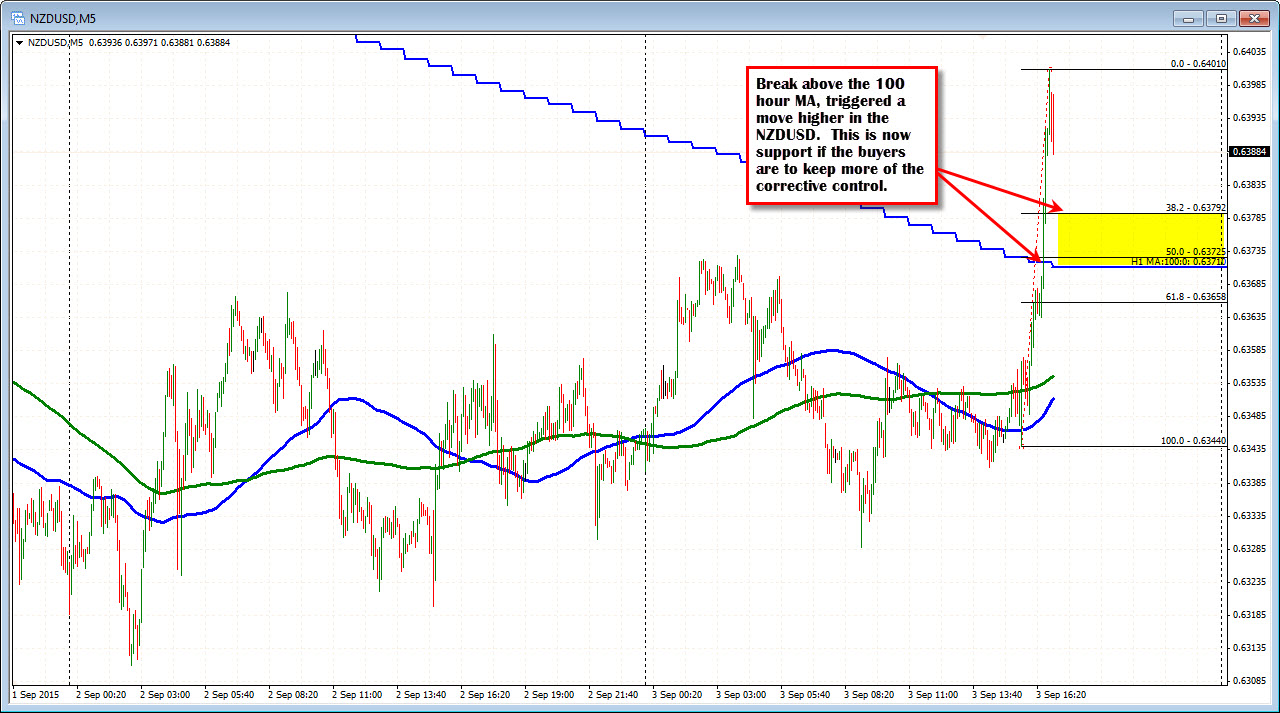
The NZDUSD broke above the 100 hour MA (blue line in the chart below), and the move has led to a scoot higher in the pair. The 100 hour MA comes in at the 0.6371 level. The price peaked at 0.6401 so far (hmmmm. you worry a little about those highs near a big figure like 0.6400 but...).
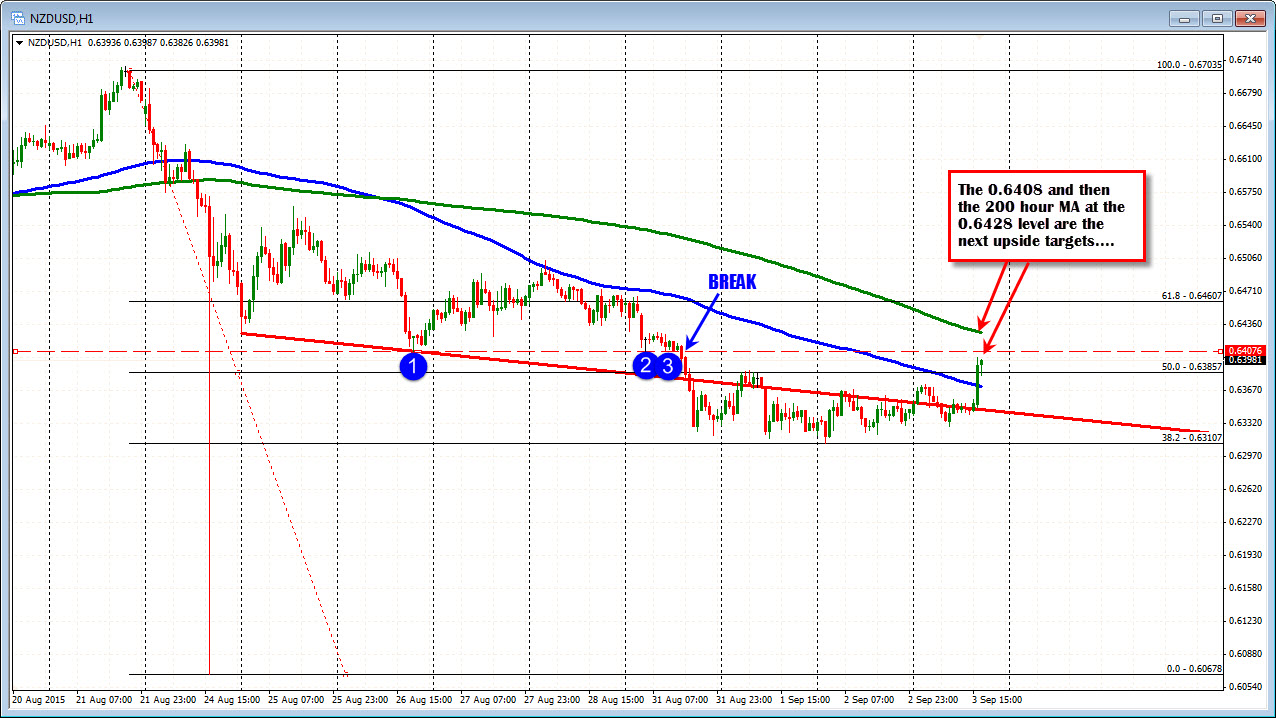
The move and close above the 100 hour MA was the first since August 24 - the Dow down 1000 day. ON that day, the NZDUSD fell out of bed and made a mess of the hourly chart (I hate those long bars).
In any case, traders have to respect the break, and look for support to hold on dips toward that MA level. At the same time, traders will also be looking for increased upside momentum, with the next target at the 0.6408 and then the 200 hour MA at the 0.6428 level currently. Look for sellers against the 0.6428 (if it can continue the upside momentum).
Looking at the 5 minute chart, the 38.2% -50% of the move higher will be eyed as support. The 50% is currently just above the 100 hour MA which increases that levels importance. Oil is up, copper is up. The CRB index is up which may be contributing to the better tone in the commodity currencies. USDCAD is falling and the AUDUSD is moving toward the 100 hour MA at the 0.7073 level. NOTE: The chart shows the momentum on the break above the 100 hour MA more clearly.