
What are the technicals saying
Adam Button points out that RBNZ Wheeler declined to comment on the value of the NZD in his press conference and doing so is a change from what is a normal jawboning of the NZD lower.
The NZDUSD has indeed risen. What are the technicals now saying for the pair.
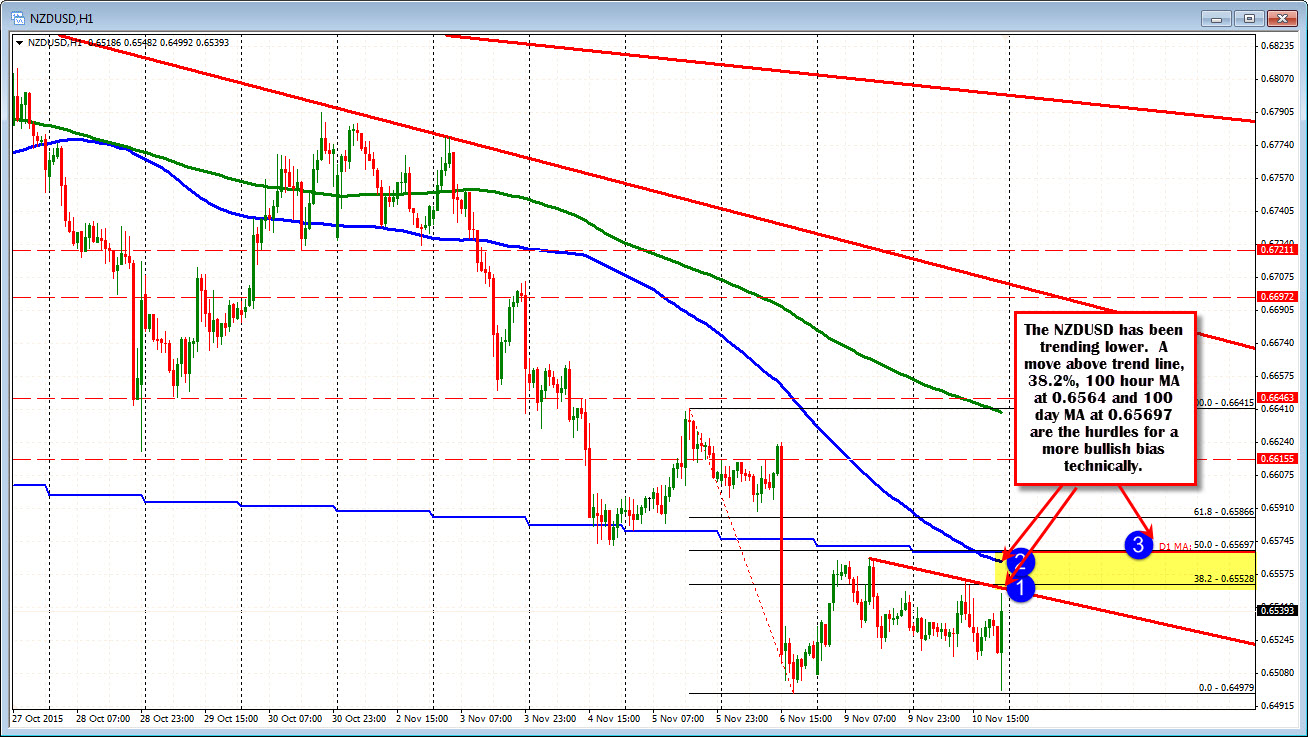
Looking at the hourly chart, the NZDUSD has moved higher and is trading now above the close from yesterday at 0.6531. The high has extended up to 0.6548. The high for the day comes in at 0.6555.
The next key target is the 100 hour MA (blue line in the chart above, which currently comes in at 0.65644. Not far from that level is the 100 day moving average at 0.6569 that is also the 50% retracement of the move down from last Thursday's high to the low reached on Friday.
So the next key resistance area to get and stay above are those moving average levels between 0.6564 and 0.6569. A move above those levels is needed to really turn the tide around for the pair technically. That should lead to further upside momentum for the pair.
Where is risk?
Well, the low from last week and just before the reports release at 0.6498 is an obvious risk level.
Is there some place closer where longs can lean against as a risk defining level?
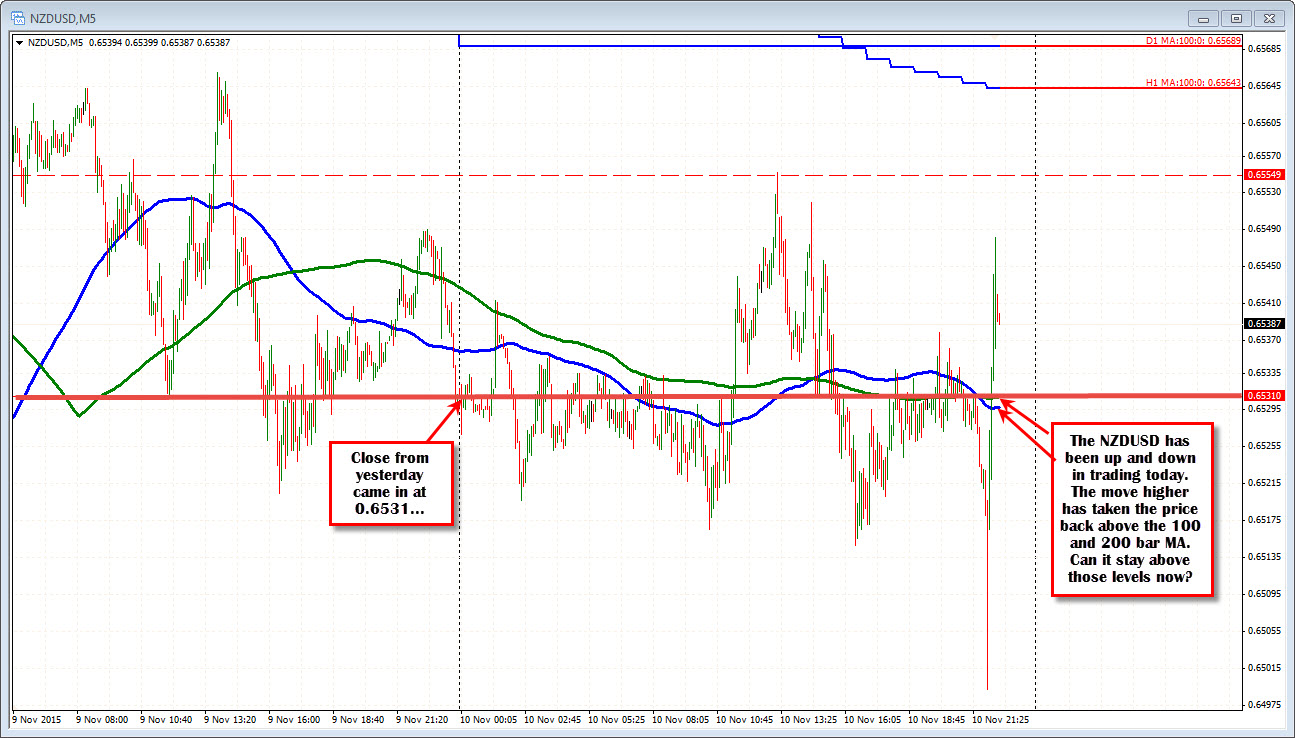
Looking at the 5 minute chart below and, the closing level from yesterday and the converged 100 and 200 bar MAs come in at 0.6530-31 area. Stay above and the bulls are in control. Move below and technically, you can say, the shorts or sellers have more of the upper hand - at least in the short term.
So there are some technical levels in place. The upper boundaries defined by the 100 hour MA and the 100 day MA make for a formidable ceiling to get to and through. However, if the market can build a bullish case from the shorter term technicals, perhaps that ceiling can be broken.

