Trading below 2010 low at 1.4227/30 area.
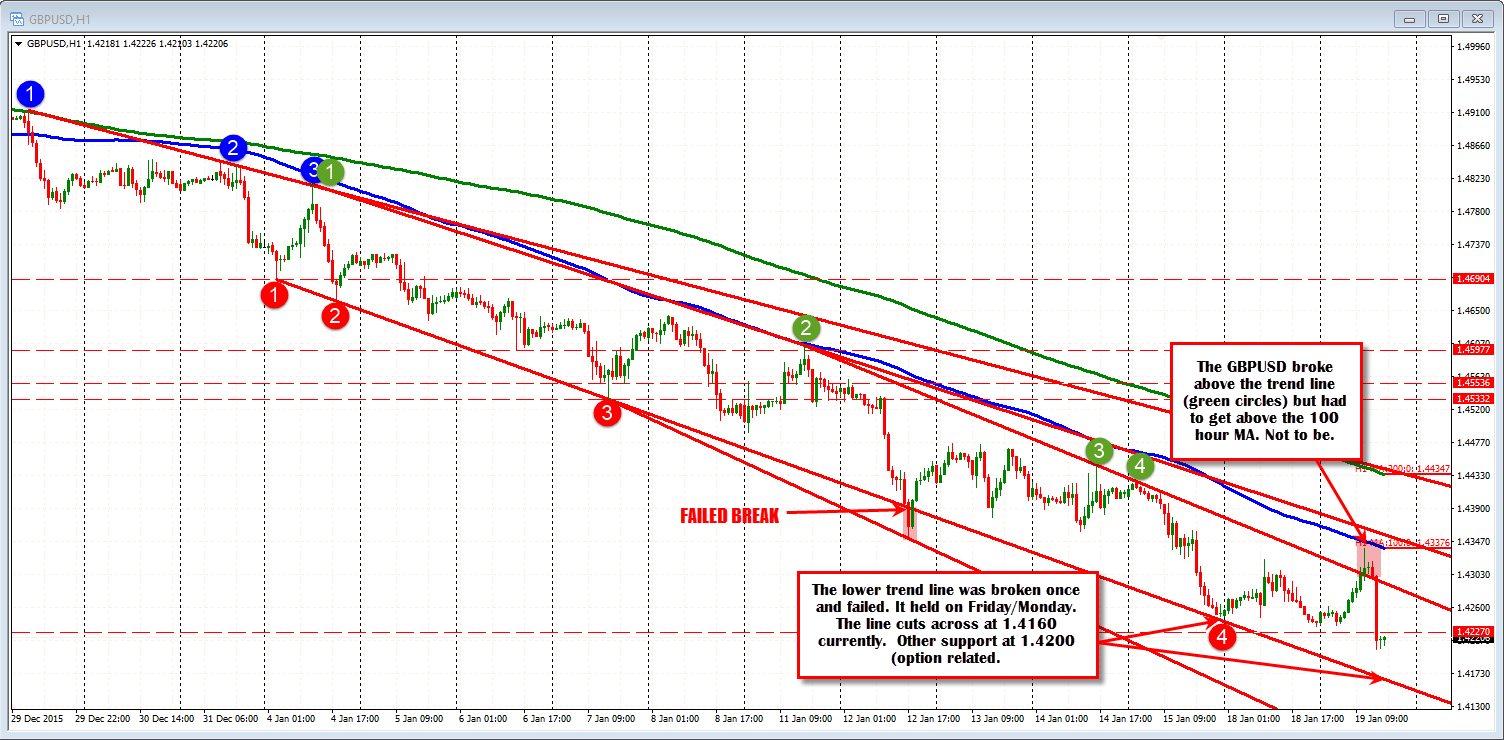
The GBPUSD fell below the 1.4227/30 level which now has the price trading at the lowest level since March 2009. The low extended to a low of 1.4205 (whoops being broken now). There is option support at the 1.4200 level (UPDATE: NOW BROKEN). Comments from BOE Carney did not help to support the pair. Technically, the market failed in its attempt to get and stay above topside trendline and extend above the 100 hour moving average earlier today(blue line in the chart below). The last time the GBPUSD traded above the 100 hour moving average was back on December 29, 2015. Today, got close but no cigar. Bears remain in control.
So where is the next support now that the 1.4200 level has been taken out?
Looking at the hourly chart above, there is a trend line connecting lows going back to January 4 (see red circles). On January 12 that lower trendline was broken, but only briefly. On Friday of last week and Monday, the trendline was tested once again (see red circled 4), and held. So the market - short of support targets - may have one in that lower trend line.
As I type, the 1.4200 level is being broken. With the barrier now breached, the next target may just be that lower trendline which currently comes in at the 1.4160 level. Be aware. The bears remain in firm control.
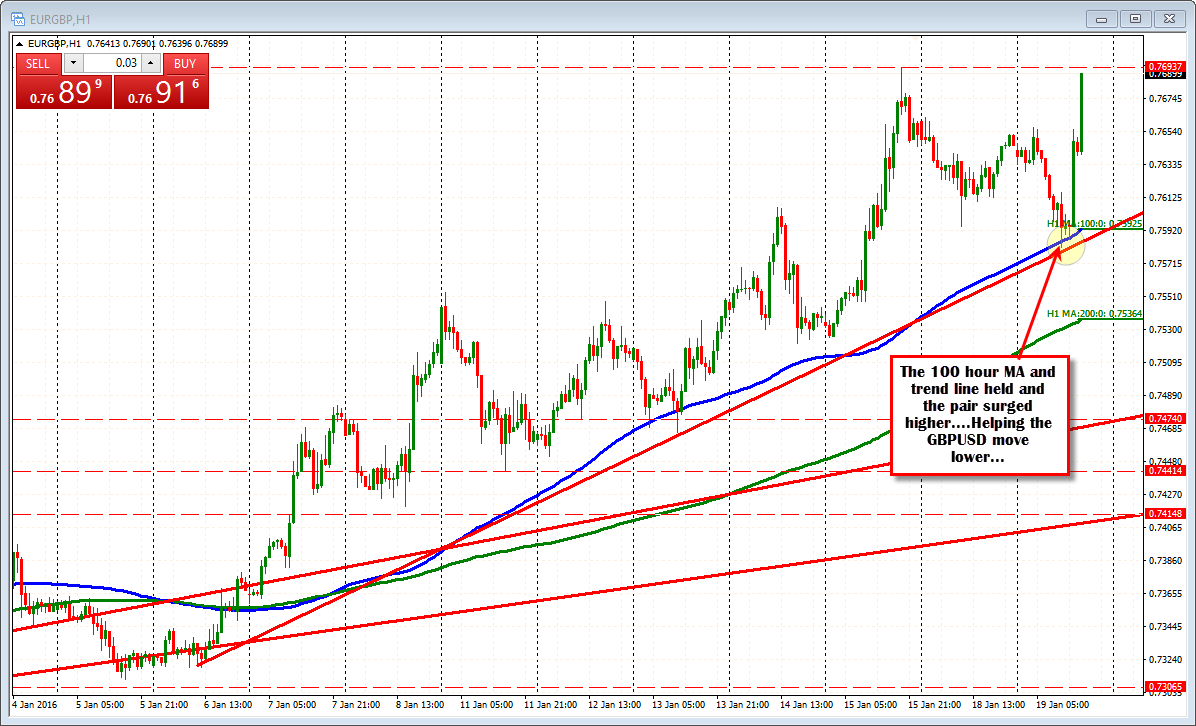
PS. EURGBP helping out.. Pair is squeezing higher after holding trendline and the 100 hour moving average earlier in the day.