
7 of the last 8 trading days are lower
The GBPUSD is trading at new session lows despite the lower US data (Empire manufacturing).
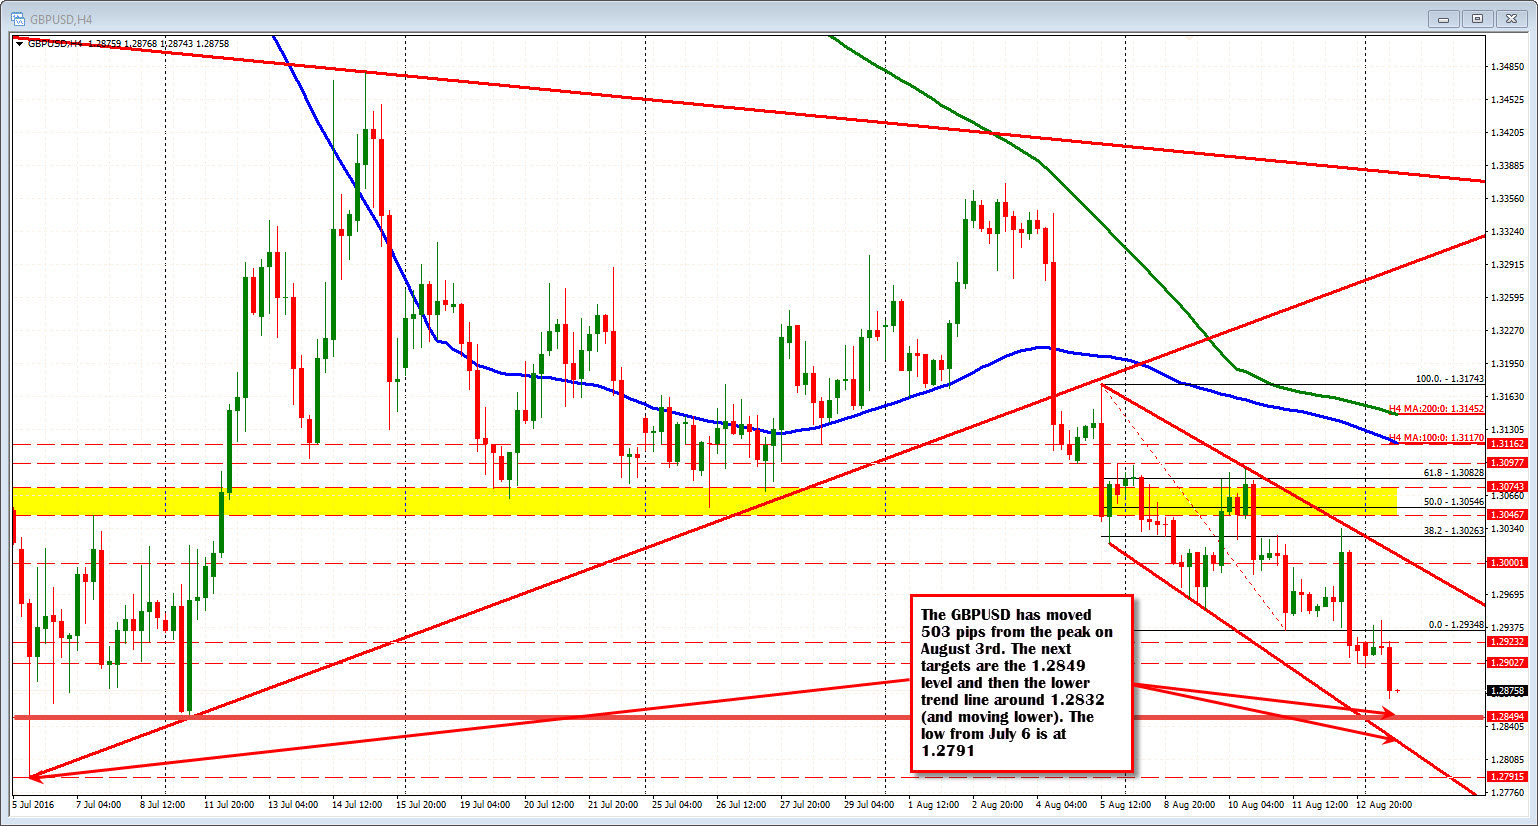
The low has extended to 1.2868 (currently back up to 1.2878). The July 11 low at 1.2849 area is the next target for the pair (see 4-hour chart above). There is a trend line that cuts across recent lows at 1.2832 currently (and moving lower). The low from July 6 comes in at 1.2791.
The pair has moved lower over 7 of the last 8 trading days after peaking at 1.3371 on August 3rd. So over that 8 trading days, the pair has moved a total of 503 pips. Half of the move came on the BOE cut, but the pair has had challenges moving higher.
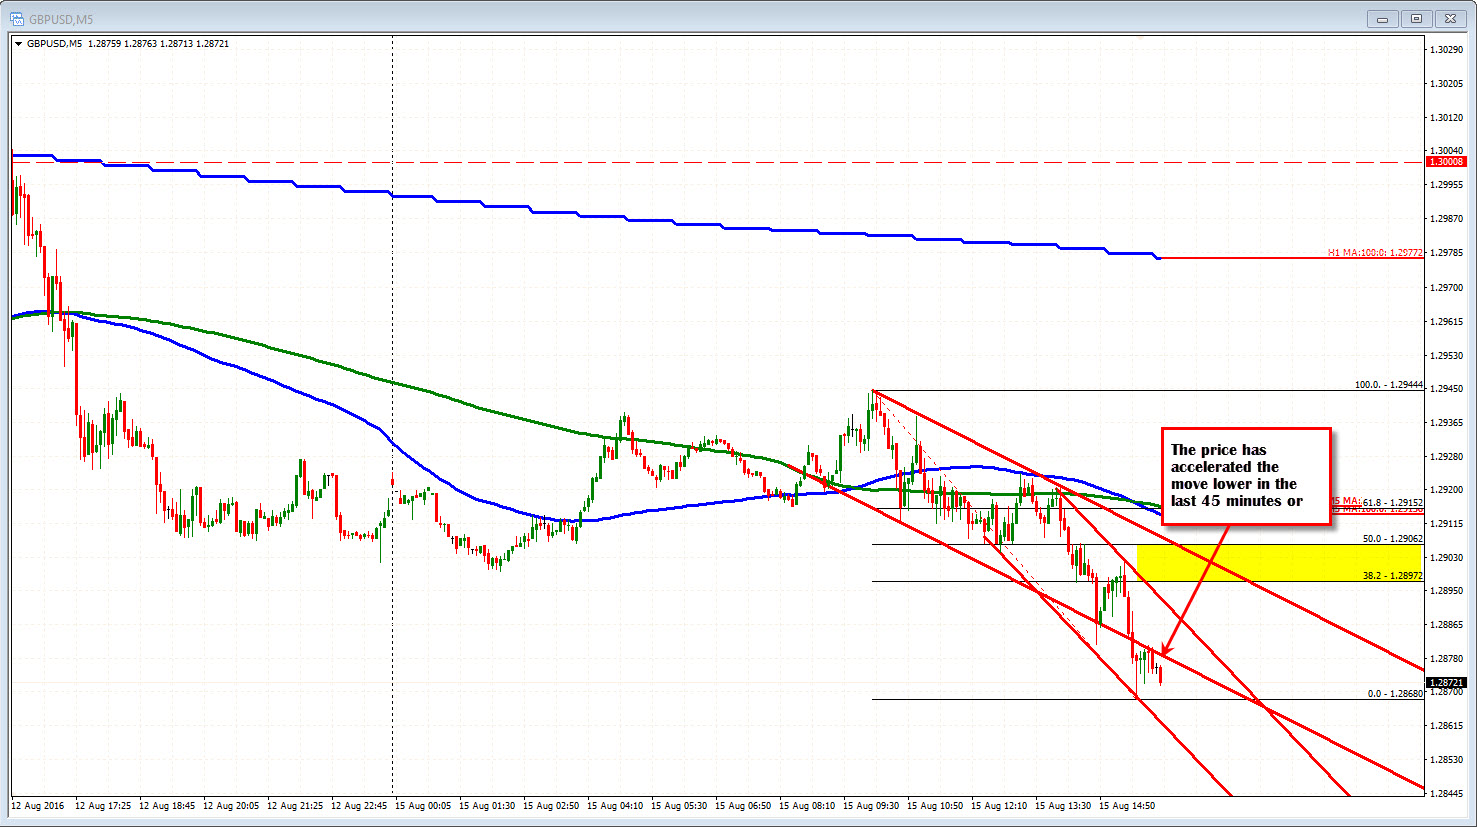
Looking at the 5-minute chart below, the pair has accelerated the decline lower over the last 45 minutes (steeper channel forming). THe 38.2-50% of the move down today comes in at 1.2897-1.2906. Staying below that area keeps the sellers in control.
This week, some post Brexit July data will start to come out. The expectations in the market seems to be that a hurricane is approaching so batten down the hatches. Whether it is sell the rumor, buy the fact, we will not know until we know. How will we know? By using technical tools that give us clues that the bias may be swinging around OR the bias is remaining bearish. Define and limit your risk. If the market is not doing what you expect it to do, get out.

