
Back above the 100 hour MA....
The GBPUSD has had a pretty up and down time of it in the early North American session. The price rose to the post NFP high at 1.3017 early, fell to 1.2920 and back up to 1.3006. The pair currently trades at 1.2976.
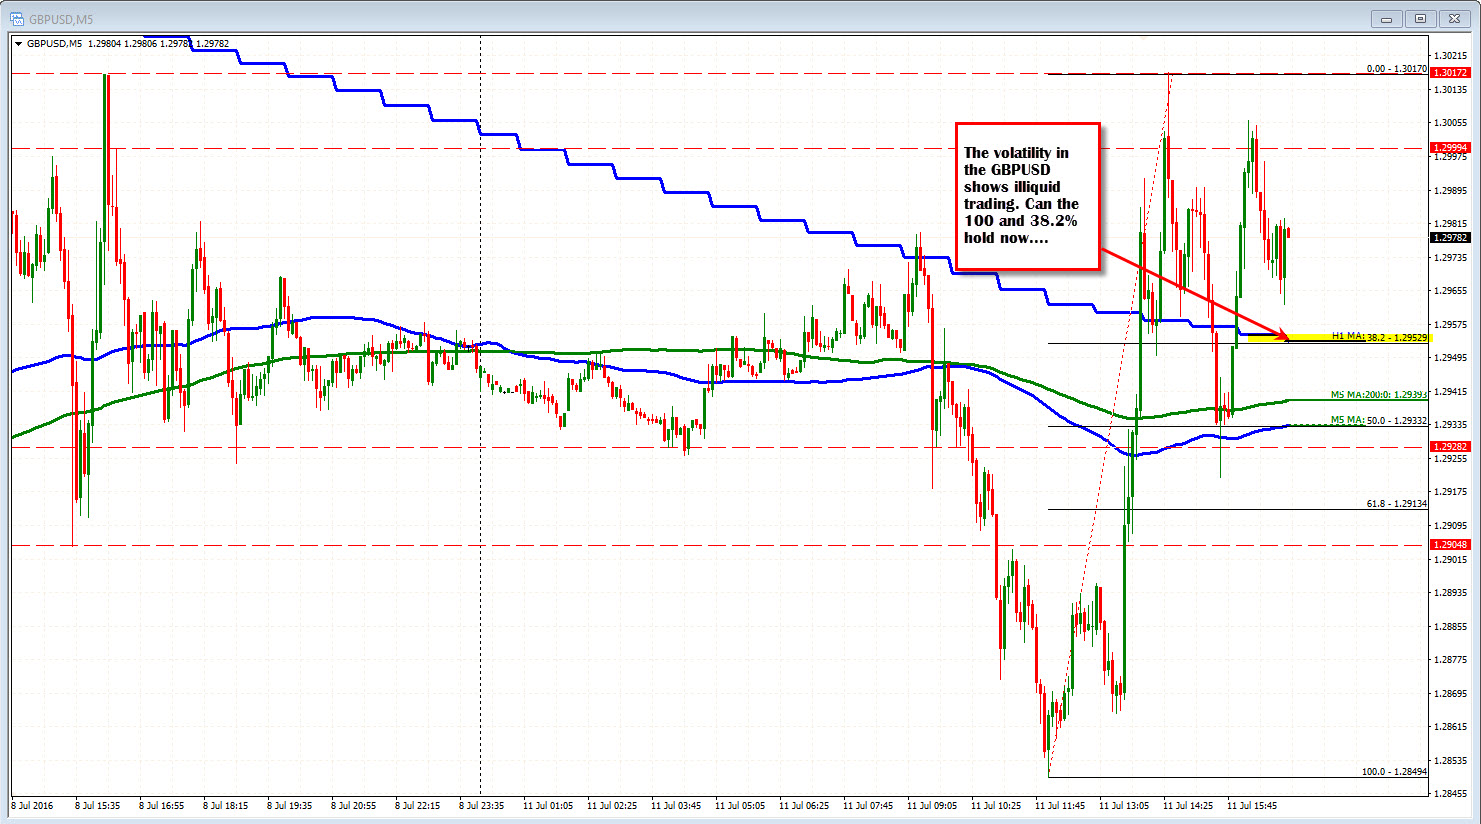
The 100 hour MA (blue overlay in the 5 minute chart below) comes in at 1.29529. The 38.2% of the move up today comes in at 1.29529. On the way down from the 1.3017 peak, the price scooted below the 100 hour MA and did the same thing on the way back up. Will traders lean against both levels on a correction back to it?
It is worth a try if it gets back down toward it.
Let's face it though...the action suggests a bit of a illiquid market still (we saw that after the employment number on Friday too). It is good if you catch a break and run, but the price action shows it can take it away as fast as it gives it. So pick your spots - like the 100 hour MA/38.2% area - and if it holds.... be on the lookout for targets above to take profit (like the 1.3000-17 area).
If the action remains random (i.e. we break through the 100 hour MA and 38.2% without much of a problem), be cautious with a finger on the "get out" button.
Sometimes the market misbehaves (i.e., does not have the normal liquidity) and you don't want to be caught trading too often in those types of markets. They can break and scoot. In those markets, look for some acceptance of a risk defining level to give some comfort. If not...stay out of the brawl.

