
Helped by EURGBP reversal
The GBPUSD has pushed back above 1.4400 level after breaking below a lower trend line and failing on that break (see chart below).
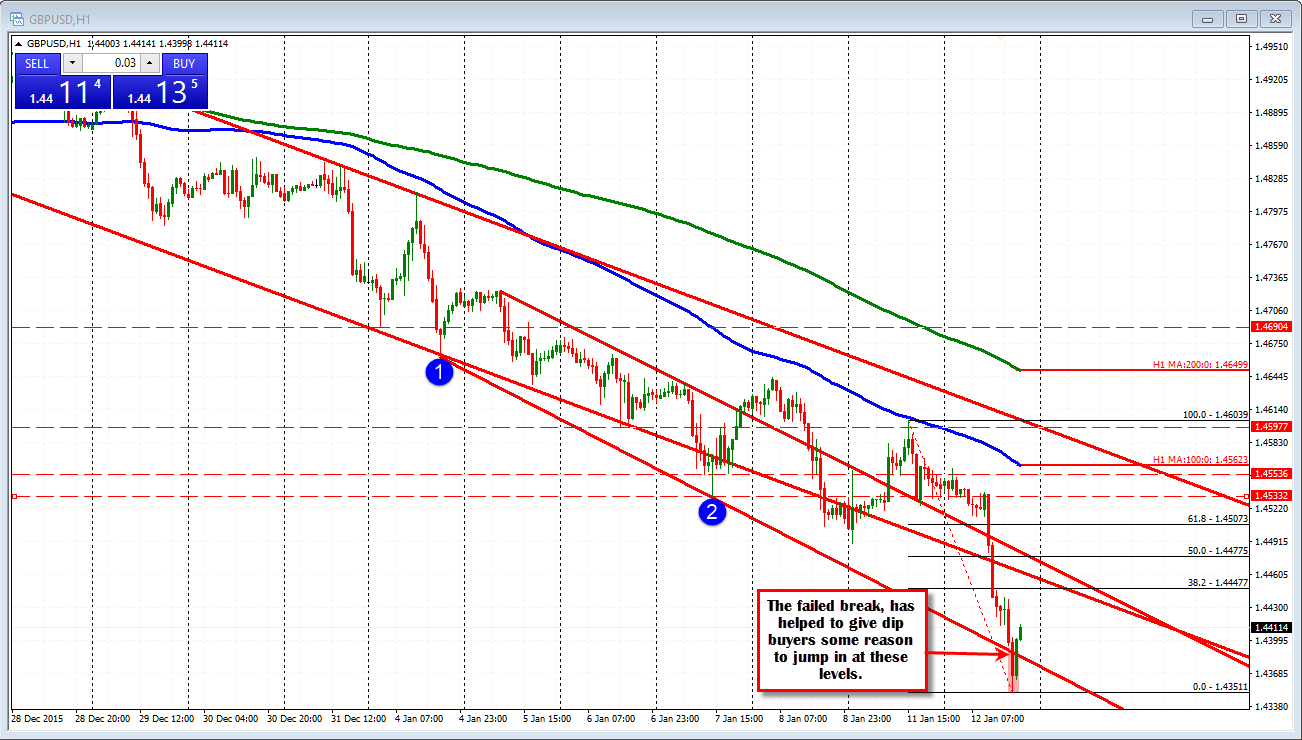
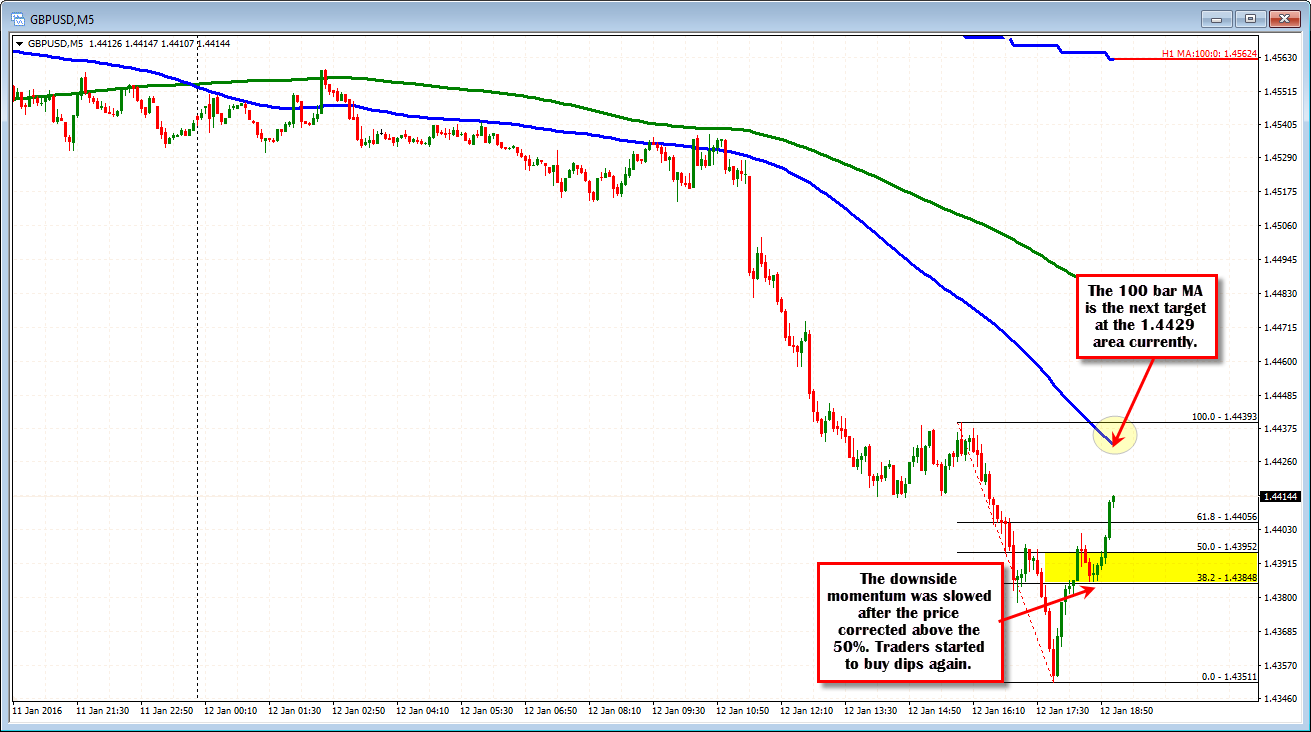
The pair had been trending lower in trading today (see 5-minute chart below). The last leg lower in the NY session, took the price to a low of 1.4351 - just above the June 2010 low at 1.4345 (the next target).
The subsequent rally off that support, has taken the price above the 38.2-50% retracement of that last trend like lower leg lower (see yellow area in the 5 minute chart below). The breach shows buyers are winning a battle finally. Better dip buying has ensued.
So overall, the market is at a more balanced at these levels. There still is resistance against the 100 bar moving average on the 5 minute chart (see chart below) which currently comes in at the 1.4429 level. This should attract some selling interest on the first test. Be aware.
The rally higher has also been helped by a reversal in the EURGBP. Looking at the 5-minute chart below, the pair fell short of the high reached yesterday at the 0.7553 level (the high reached 0.75474). The fall lower has taken the price below the 100 bar moving average and the 5 minute chart, the 0.75168 level. There is decent support. However, below at 0.7500 where the 200 bar MA on the 5 minute chart is found ( green line in the chart below), the 50 % and the trend line off today's lows all are clustered together. That should give sellers a cause for pause, with stops below.

