The selling continues
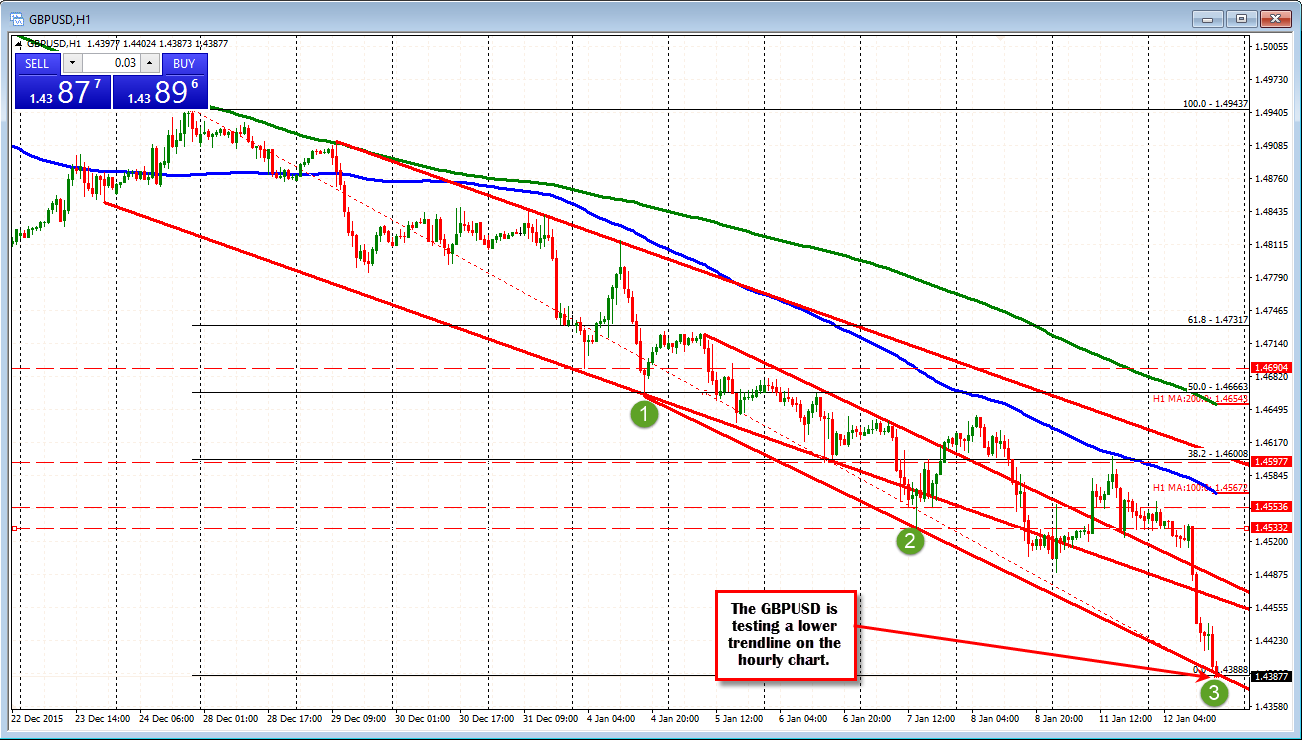
Weaker UK data this morning has sent the GBPUSD lower in trading today- continuing the trend. Nine of the last 10 trading days has been to the downside- yesterday was the exception. The pair corrected higher but ran into resistance against the 100 hour moving average (blue line in the chart below). Today, the price is extending to the downside and trades at the lowest level going back to June 2010. Looking at the hourly chart, the pair is testing a lower trend line at the 1.4391 level (on it now). This should slow the decline but in a trend market you have to be careful). Trends are fast, directional and tend to go further than traders expect. The burden of proof is on the buyers to show they can take back some control.
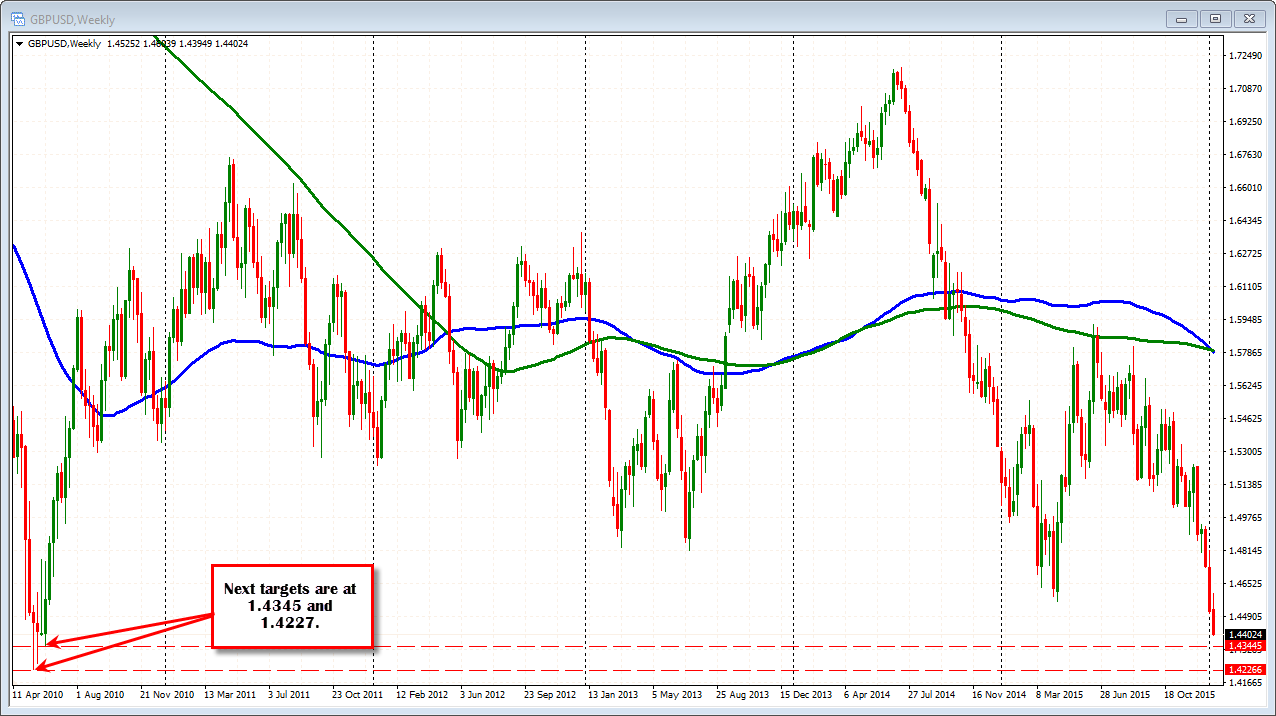
Looking at the weekly chart, there is not much support until 1.4345 (low from the week of June 6, 2010). The swing low from the week of May 16, 2010 comes in at 1.4227.
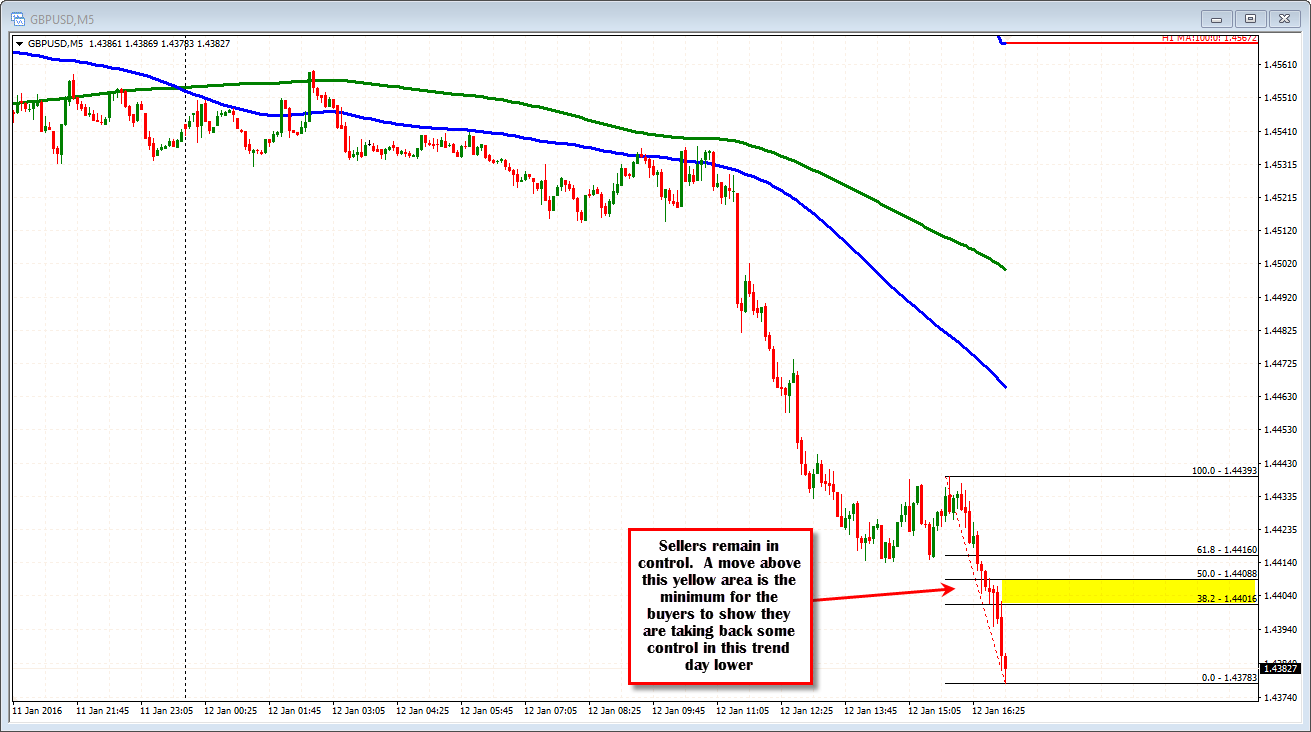
Drilling down to the 5 minute chart, the pair is moving below the support trend line on the hourly chart as I type (at 1.4391), and sellers are still taking the price lower. Sellers remain in control. If the buyers are to show they can slow the decline, a move back above the aforementioned trendline at the 1.4391 level will be eyed. In addition to that, a move back above the 38.2 to 50% retracement of the last leg to the downside is the absolute minimum for buyers to show they are taking back more control (see yellow area in thechart below). That area comes in between the 1.4401 to 1.44088 prices currently (see chart below).
Sellers are in control.