
Up and down action between support/resistance levels.
Yesterday the GBPUSD trended lower into the NY afternoon session, then died down. The low for yesterday stalled at near the 50% of the move down from the post-Brexiit high to the post-Brexit low. That level comes in at 1.31629 and the low reached 1.3165. So support held at the 50% level (see daily chart below).

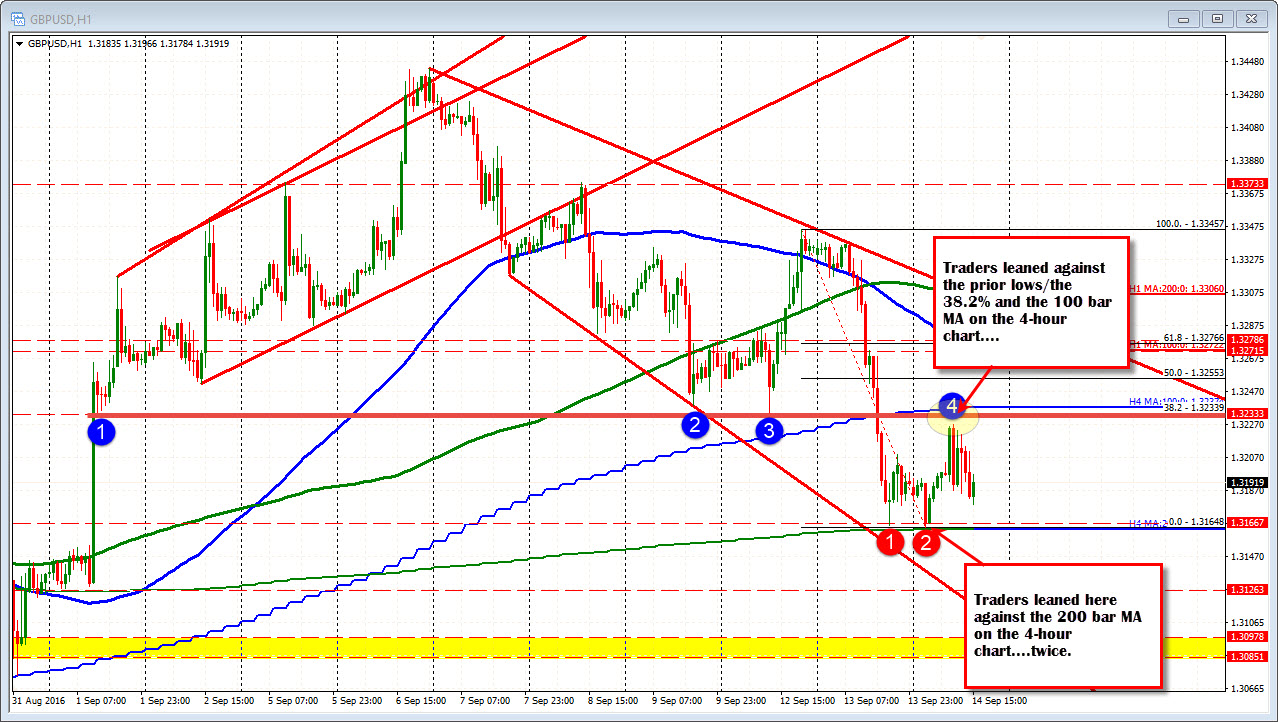
Also at that level sits the 200 bar MA on the 4 hour chart (see green step line in the chart below). Traders leaned. The trend stopped. The market said enough was enough.
The new trading day has seen the price retest the support levels once again (both on the daily at the 50% and against the 200 bar MA on the 4-hour chart). When that held in the Asian Pacific session (buyers leaning), a modest correction took the price to the underside of a broken trend line on the daily chart and near the 100 bar MA on the 4-hour chart (blue step line at 1.3237 currently). The corrective high was also near the low from Monday's trade at 1.3233 (the high came in at 1.3227) and the 38.2% of the move down from the week's high at 1.32339 (see hourly chart below). I would expect that resistance given the trend move yesterday. Traders don't always easily give up on strong trend.
SO we sit between twice tested support below and resistance above. Ping ponging. The trend turned a little non-trend.
However, the sellers remain in control over all. The buyers off the support below (and it is good support), have had some success with two successful tests, but they seem to be trading it, and that is ok. However, unless those buyers can get the price back above the resistance outlined above, the path of least resistance seems the downside. with a break below the support looking next toward the 1.3126 area, then the lower trend line on the hourly chart above (at 1.3114 currently but moving lower). Looking at the daily chart a break would take us in the lower half of the post-Brexit range. The 1.3050 level sticks out as a level that will be tough to crack.

