What just happened?
Let's face it...The data could be diced and sliced in many different ways today and the market had a choice on how it wanted to interpret it too. Of course the market may also be on vacation with mandates to back ups to just not get in trouble. It happens. At 287K, it had a right to send the dollar higher, but if it is going higher, it needs to get to and through targets along the way. If it cannot, we have to pay attention.
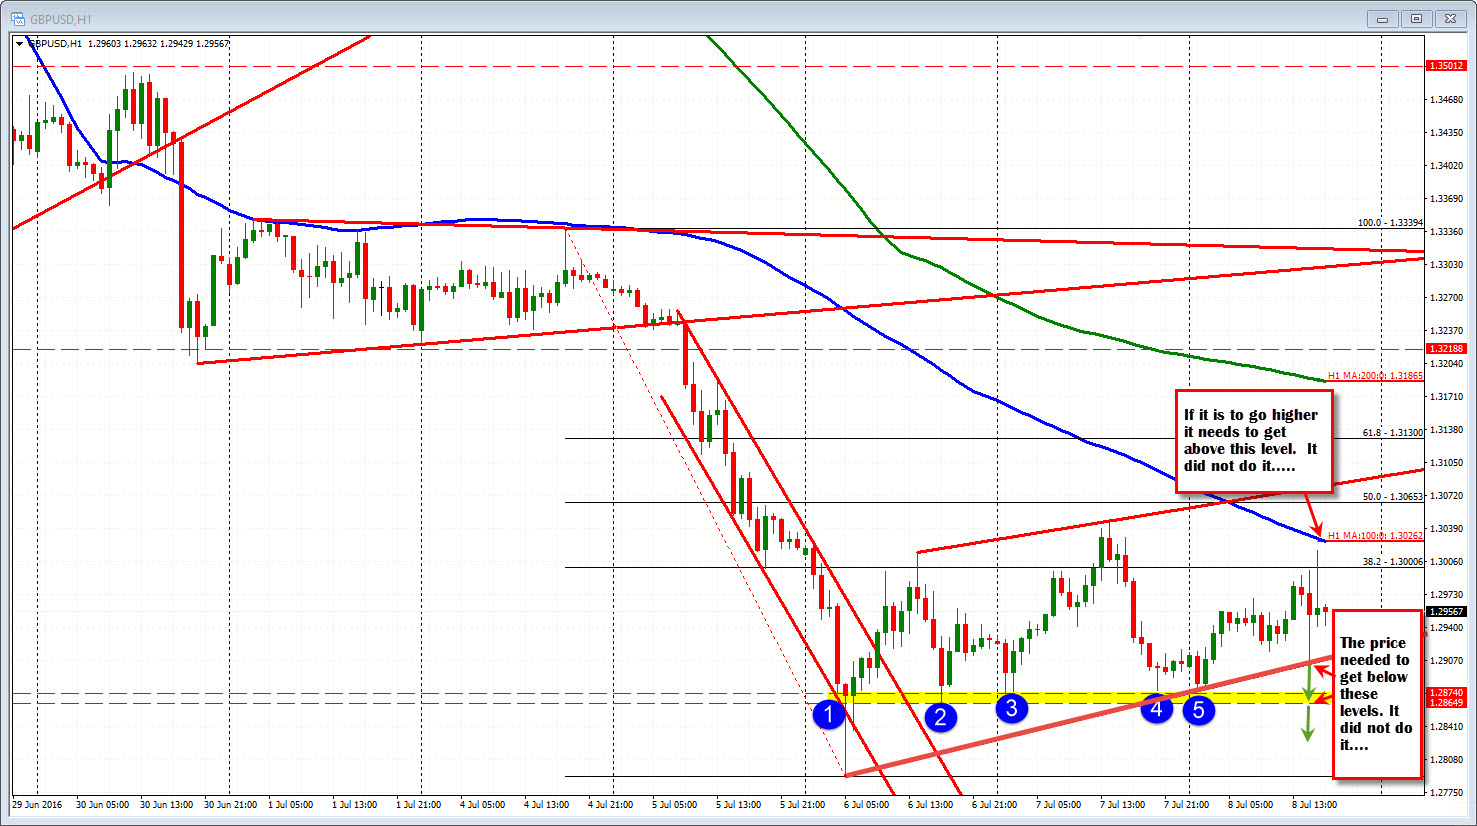
For the GBPUSD, the price had to get through the trend line connecting recent lows and then the 1.28649-74 area (see chart above). Did i? No. the price bounced off the first trend line. That is ok as long as the correction suggests that the sellers are still in control.
I like to use the 38.2-50% retracement (correction zone) as a proxy for control. If it stay below it says to me the bearish glass is still half empty (i.e. bearish). If it goes above the 50%, the water in that glass gets muddy. The sellers are not really showing that they "love it". That is what happened in this pair. It is shown in the 5- minute chart below.
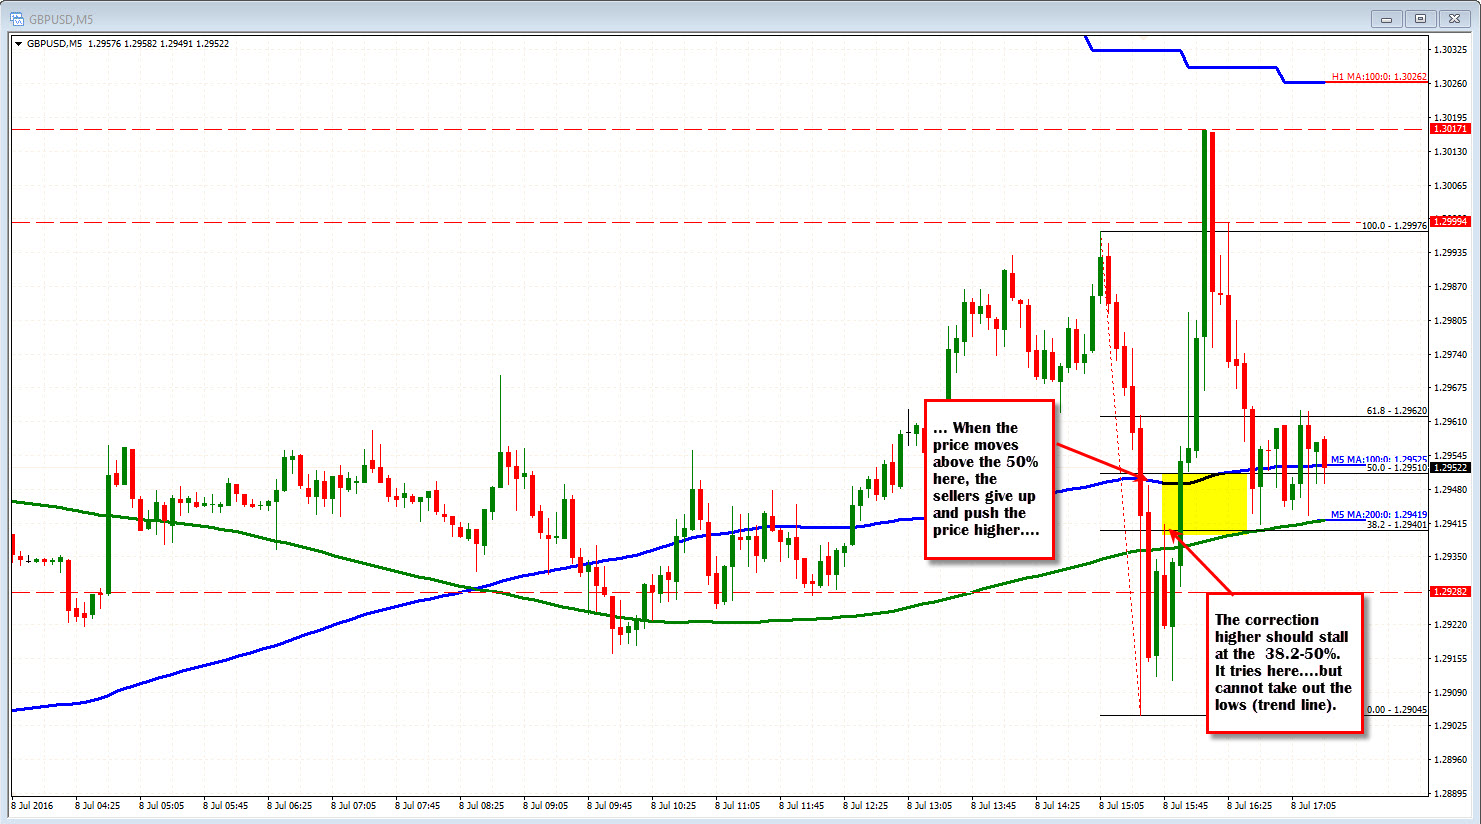
The reversal move was on, and the pair did not stop until it approached the 100 hour MA above (blue step line in the chart above).
Now what?
Well it is Friday before a weekend. There is increased event and liquidity risk over the weekend since the markets are close. Traders may look to square up.
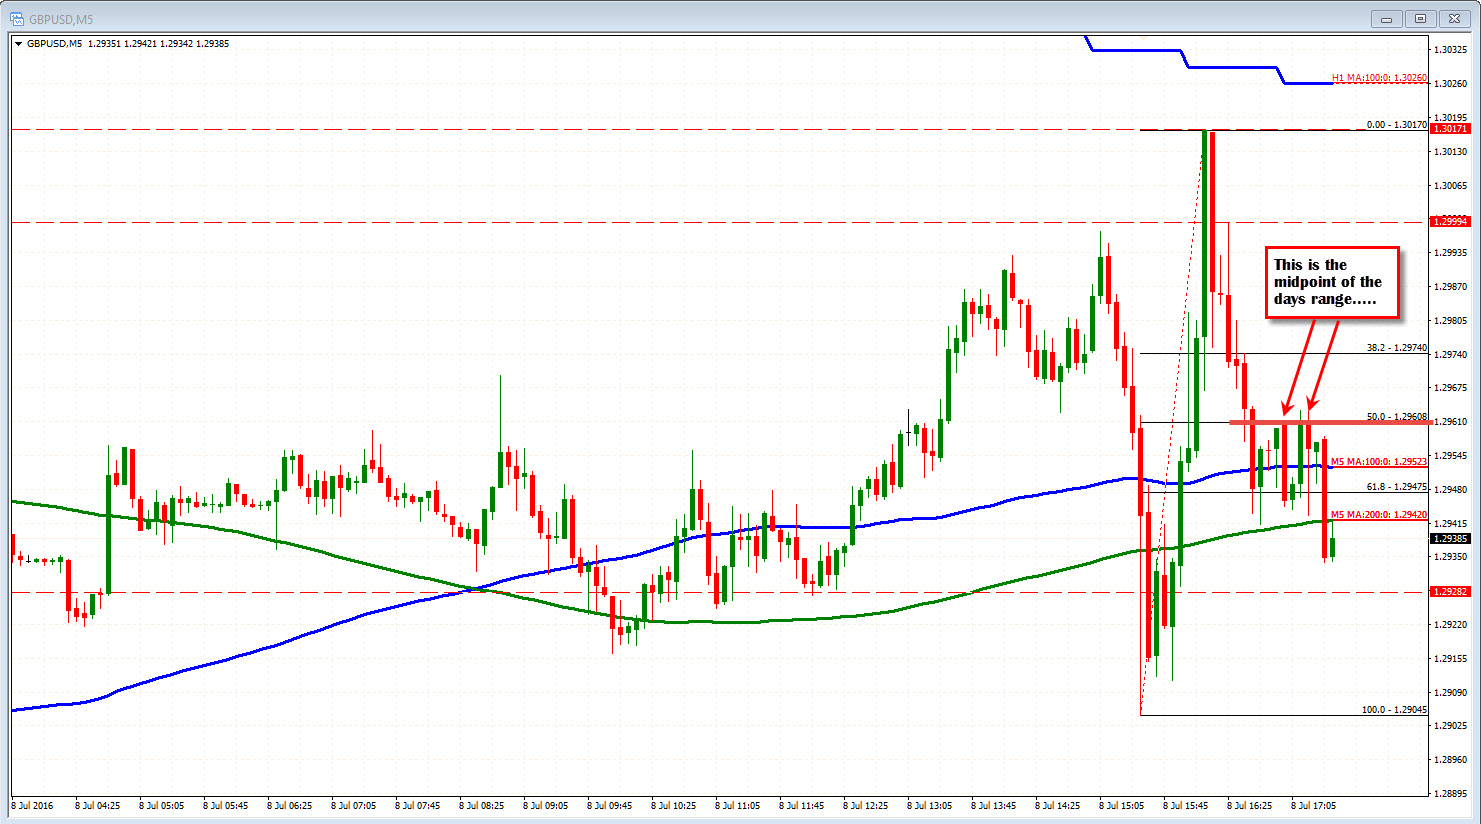
If you want to trade it still, the price is trading below the 50% of the days range at the 1.29608 (adjusted the Fibonacci to reflect that in the 5 minute chart below). That 50% seems to have sellers against it. Stay below and the market may be able to pick away at lows. Move above and the water in the glass.....it gets really muddy again. Be careful.