
Too much resistance above, reverses the pair back toward unchanged
The GBPUSD rallied higher in Asian Pacific trading and in the early London session, but ran into some technical resistance near the 200 hour MA and the 38.2% retracement of the move down from the November 19 high. Those levels came in at 1.51236 and 1.5130 respectively (at that time). The high price stalled at the 1.5125 between the two. Later weaker PMI data helped to push the pair lower and the price has been drifting lower since that time.
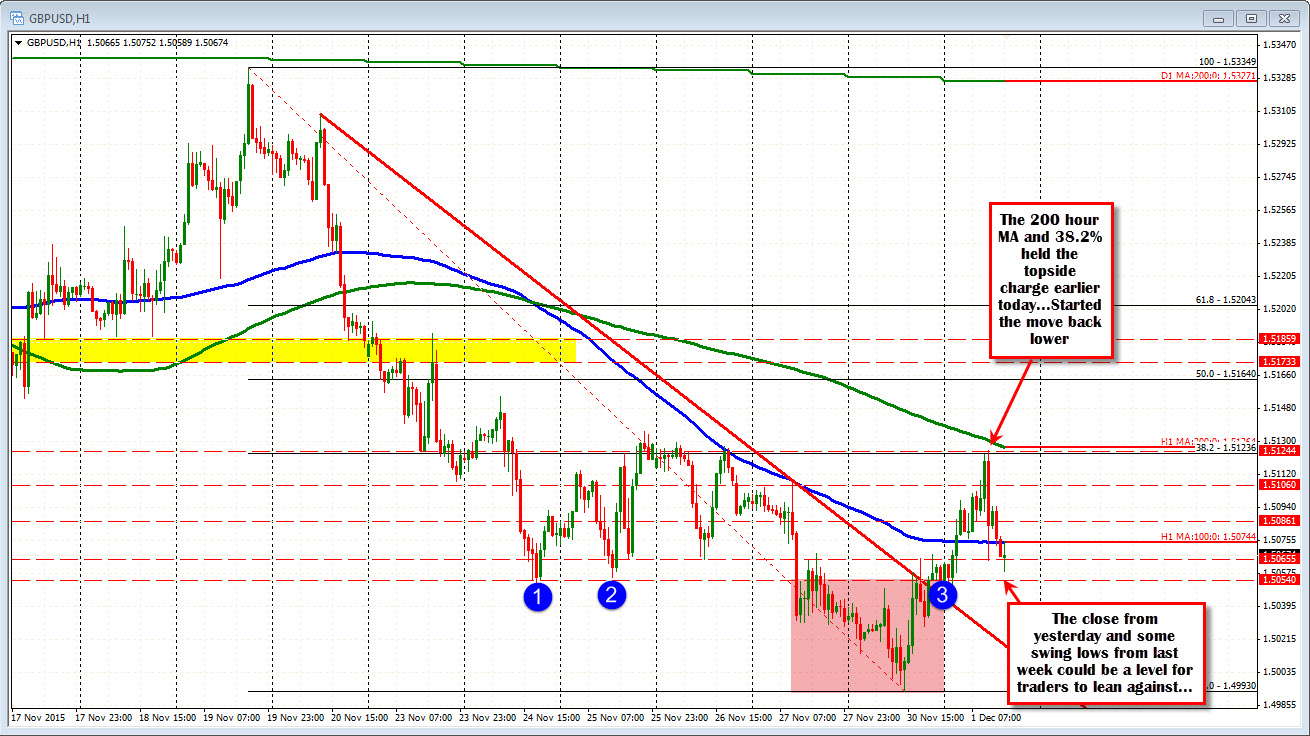
The 1.5054 was the close from yesterday. That area is also where there were swing lows from Nov 24 and Nov 25th. The midpoint of the new weeks range is at 1.5058. So there may be some intraday dip buyers against the area/ the dip. Having said that, the move back below the 100 hour MA (blue line in the chart above) at the 1.5074 will need to be re-broken if the buyers are to take more control. The current hourly bar has been able to keep that level as a ceiling.
The patient sellers waited for the 200 hour MA/the 38.2% retracement. Now with the price in mid- range, traders may look to lean against it, but ranges get more confined and technical levels start getting compressed. Nevertheless, the support outlined, defines and limits risk. It is a matter of getting the market to agree and work that price back above the 100 hour MA. We will see.

