Above prior resistance
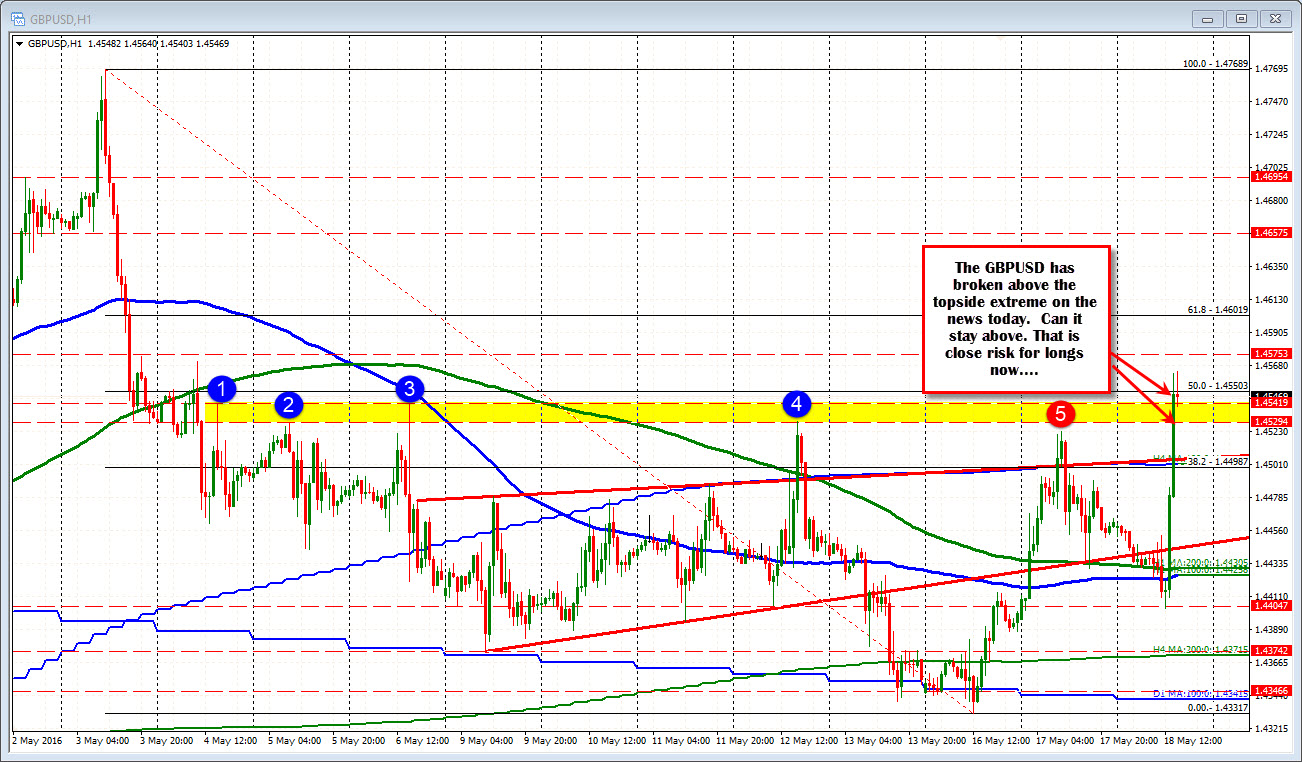
The GBPUSD has gotten a boost on the expectations that the tide is turning in the favor of a No for BREXIT. The pair shot up from a low around the 1.4400 level and in the process, has been able to extend above what has been a series of swing highs in between the 1.4529 and 1.4542 area (see numbered circles in chart below). This is now support that needs to hold.

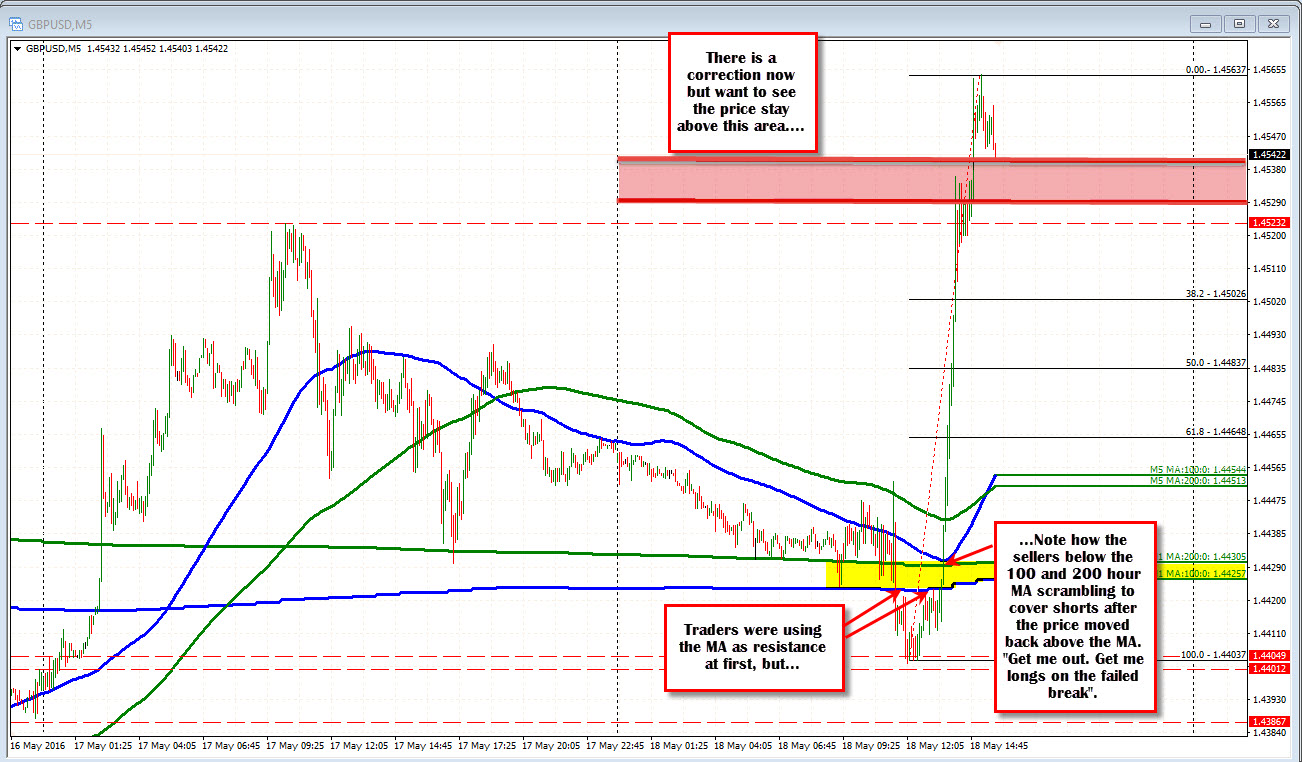
The pair on Monday, bottomed near the 100 day MA (blue step line in the chart above). The correction lower today pushed below 200 and 100 hour MA support, before the surge. Traders who shorted the move below the 100 and 200 hour MAs, were scrambling on the break back above (see the price action on the 5- minute chart below). There has not been much of a correction on the move higher. So buyers have been jumping in.

The question now is will they still love it above resistance and after a 160 pip trading range? The yellow area on the hourly chart defines the close risk for longs. Next targets come in around the 1.4575 area. The 61.8% is the move down from the May 3rd high comes in at 1.46019 and would be another target. That would imply a 200 or so pip trading range for the day.
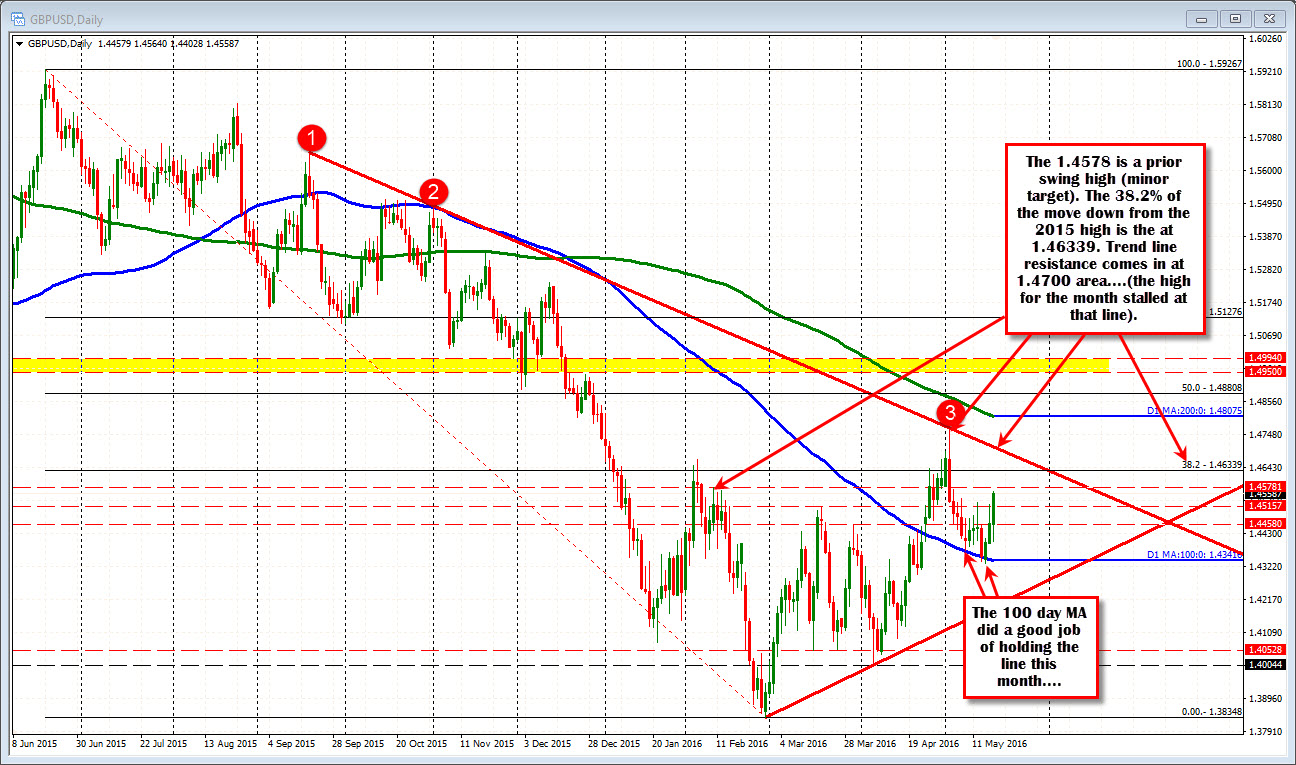
The 1.46339 is the 38.2% of the move down from the June 2015 high (see daily chart below).


