
A cluster of resistance keeps a lid on the pair
The GBPUSD surged higher in the London morning session. Looking at the hourly chart below, the pair broke above the 200 hour MA (it was a ceiling for the Asian Pacific session) and that opened the upside for further gains.
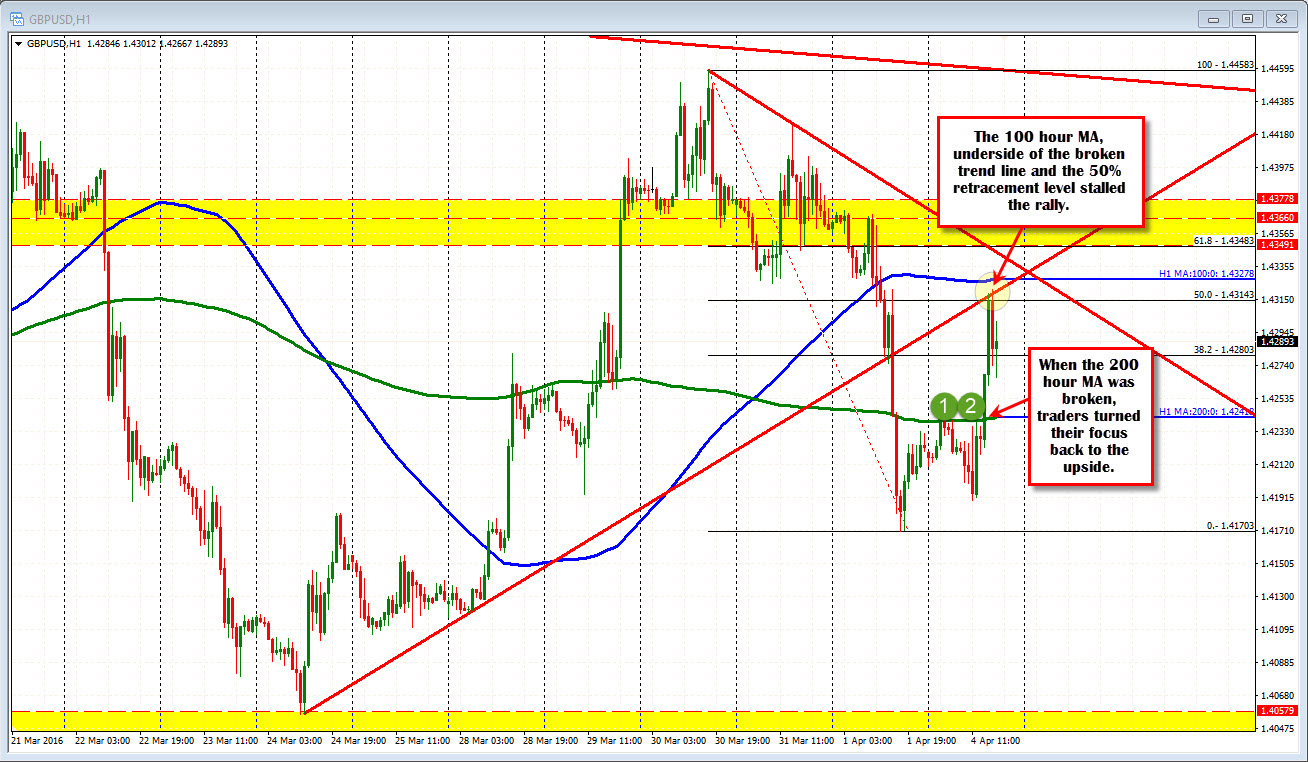
That move, however, came right up to the underside of the broken trend line at 1.4320, the 100 hour MA (blue line) at the 1.43277 level, and the 50% retracement at 1.43143. The high stalled at 1.4321.
So the pair seems to have found a good resistance area. The support can be expected at the 200 hour MA as well (what was resistance becomes support.
At some point, there will be a break, but for the time being, the traders have defined the levels and may just be happy trading between the extremes.
Which way do you see the break?

