
Now what?
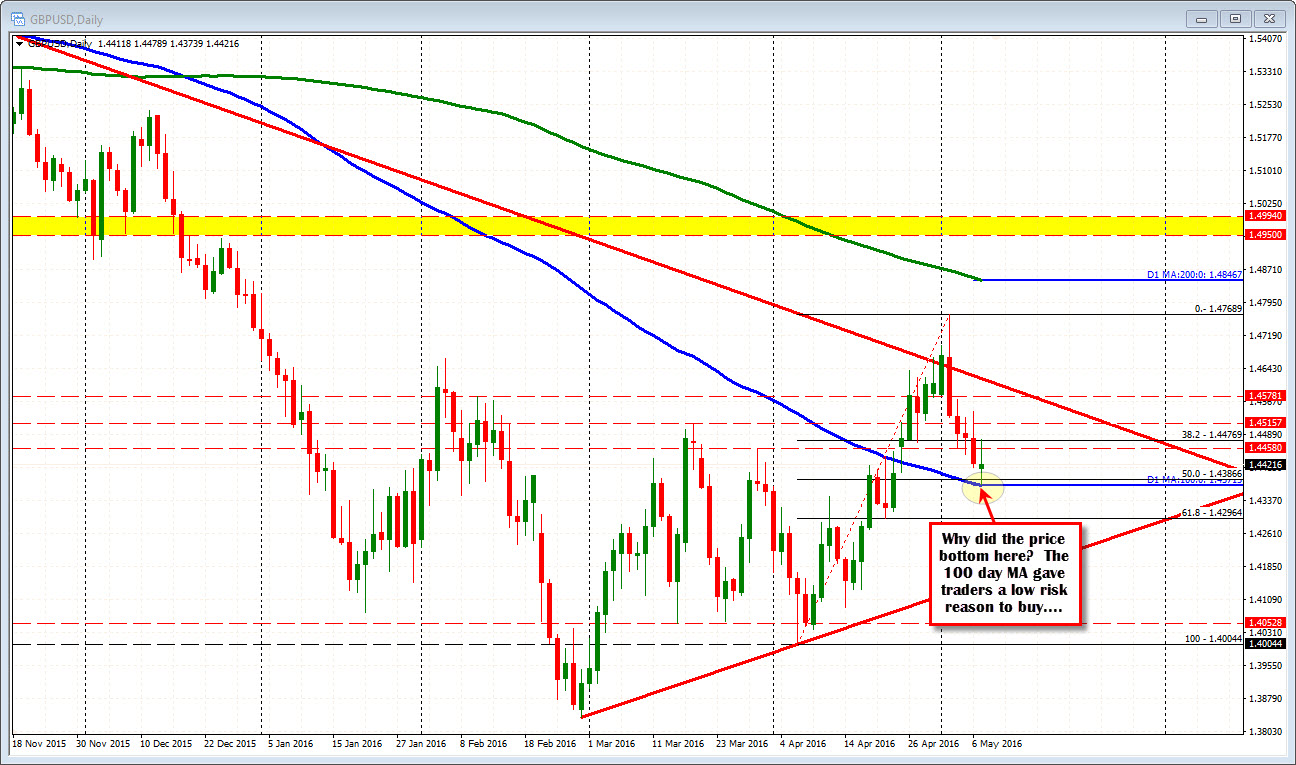
Question: Why did the GBPUSD bounce at the 1.4373 level?
Answer: Because the 100 day MA could define and limit risk (see blue line in the chart below)
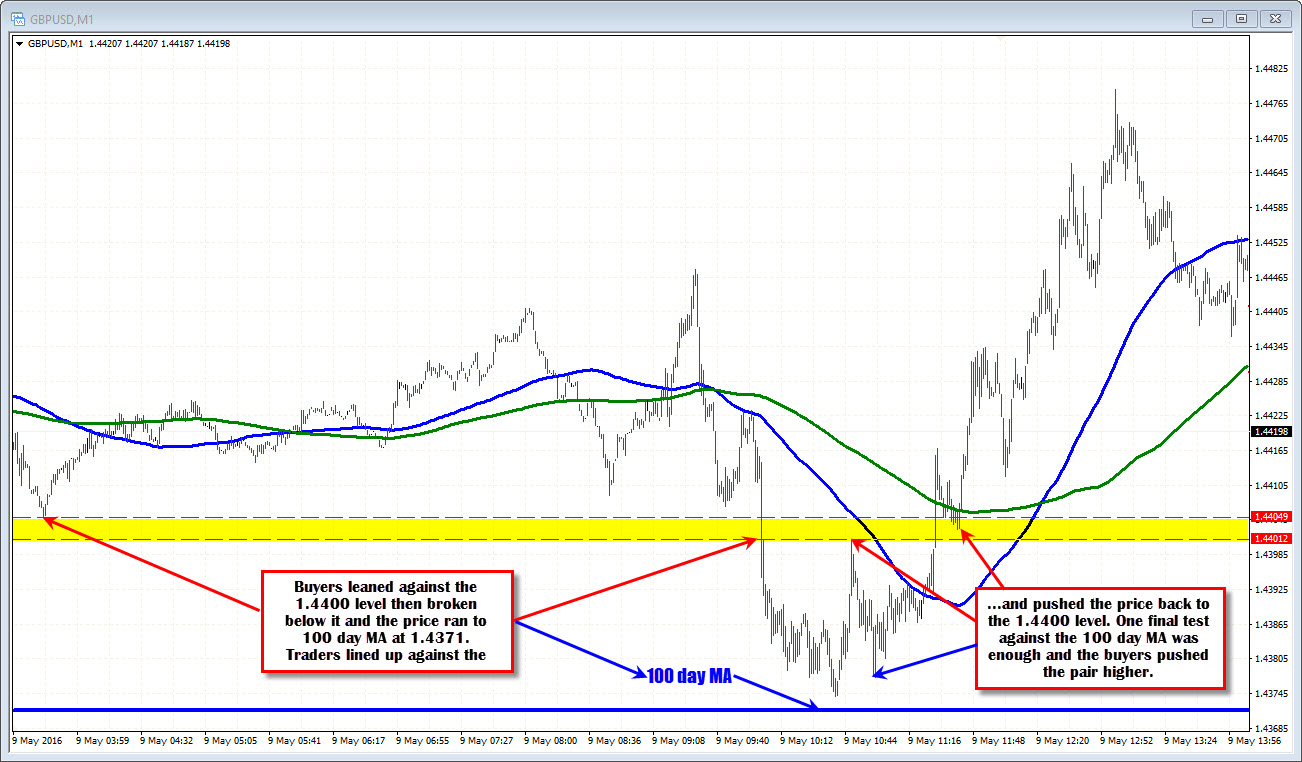
The GBPUSD tumbled below the Asian session low at 1.4405 and then the psychological 1.4400 level today (see the 1 minute chart above to show the selling) and the bias turned from buy to sell. That was until the price moved to test the 100 day MA (blue line in the chart above) at the 1.43715 level.
The low reached 1.43739 (see the price action on the 1-minute chart below) and buyers pushed the price back to 1.4400 (1.4401 was the high). Another move lower took the price to 1.4377. Once again just above the 100 day MA at 1.43715. This time the 1.4400 level was broken and the sellers turned to buyers. The bias turned back around - at least for a 100 or so pips (from the low). The price peaked at 1.4479. Trade of the day. Very low risk.
What now?
Well the 1.4400-1.4405 level was the support earlier today. The price action back down off the high just reached 1.4410. So there seems to be some buying by dip buyers. Can we head back below? Honestly, the move back off the highs is not all that encouraging technically. The price is retraced more than 50% of the move higher off the low (that level comes in at 1.4426). Normally, after a 100 pip move off a key support, you would expect to see buyers on dips (in the 38.2-50% retracement area). We are below that level. However, the 1.4400-05 area is trying to hold. So there are mixed intraday signals. If the price can hold the 1.4400 level, that would be more encouraging, but a move above 1.4438 will be eyed for proof. The battle has returned to the old level.
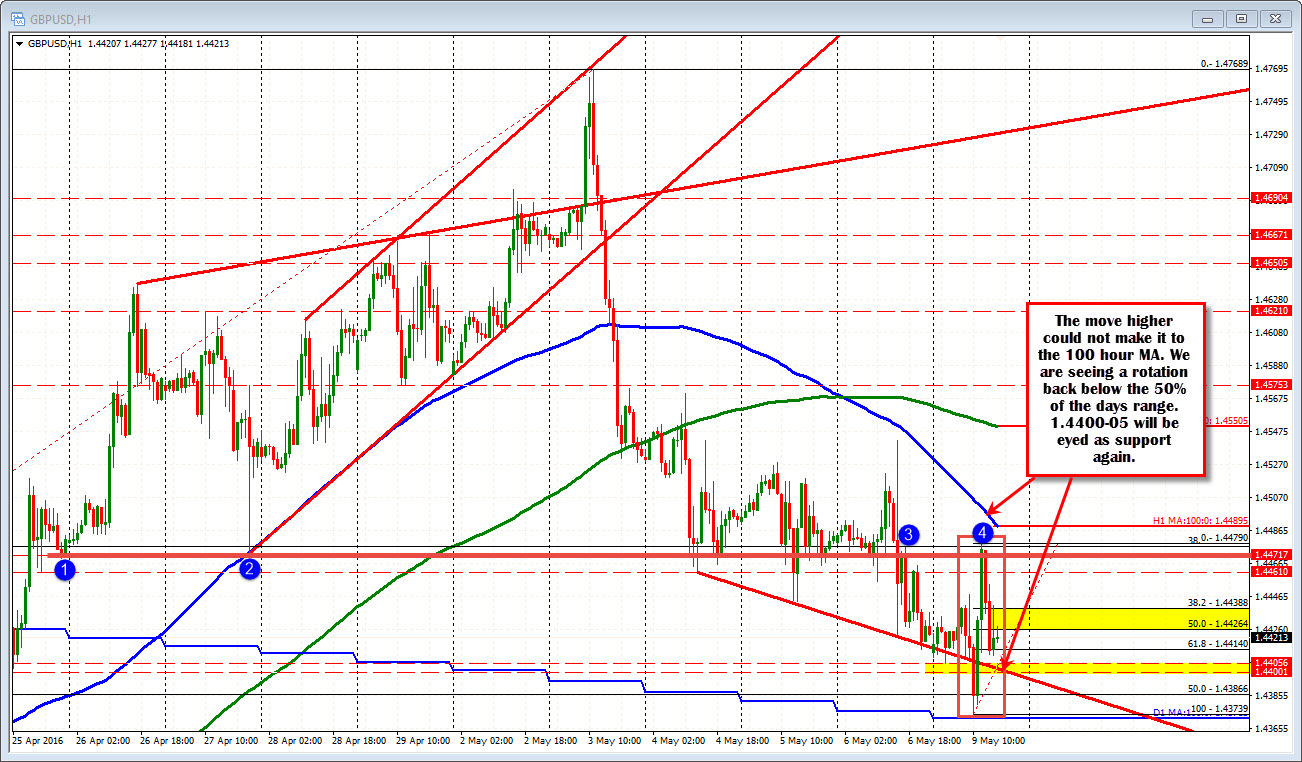
The GBPUSD found support against the 100 day MA. That trade came and buyers leaned. Now we need to see if they really meant it. Can they hold the line(s) again.

