Something about 1.3175 area
The GBPUSD moved to new session lows after the better US durable goods order data, and a new low for the day was also made at 1.3172 vs 1.3177, but there is something about the 1.3172-77 area in the GBPUSD over the last few days. Looking at the hourly chart below, sans a few bars (one on August 19 and 4 yesterday), the line area has been a dividing area between bulls and bears. Stay above it bullish. Move below it bearish (unless it fails - we always look for momentum on a break).

The low just reached 1.3172 and we currently trade at 1.3198.
In quiet markets, some levels become key levels. That is a good thing (it can happen in non- quiet markets too, I guess). A traders job is to lean against them and/or wait for a break through them (with momentum). Traders leaned today as risk could be defined/risk could be limited (see video here).
Now where do we go from here?
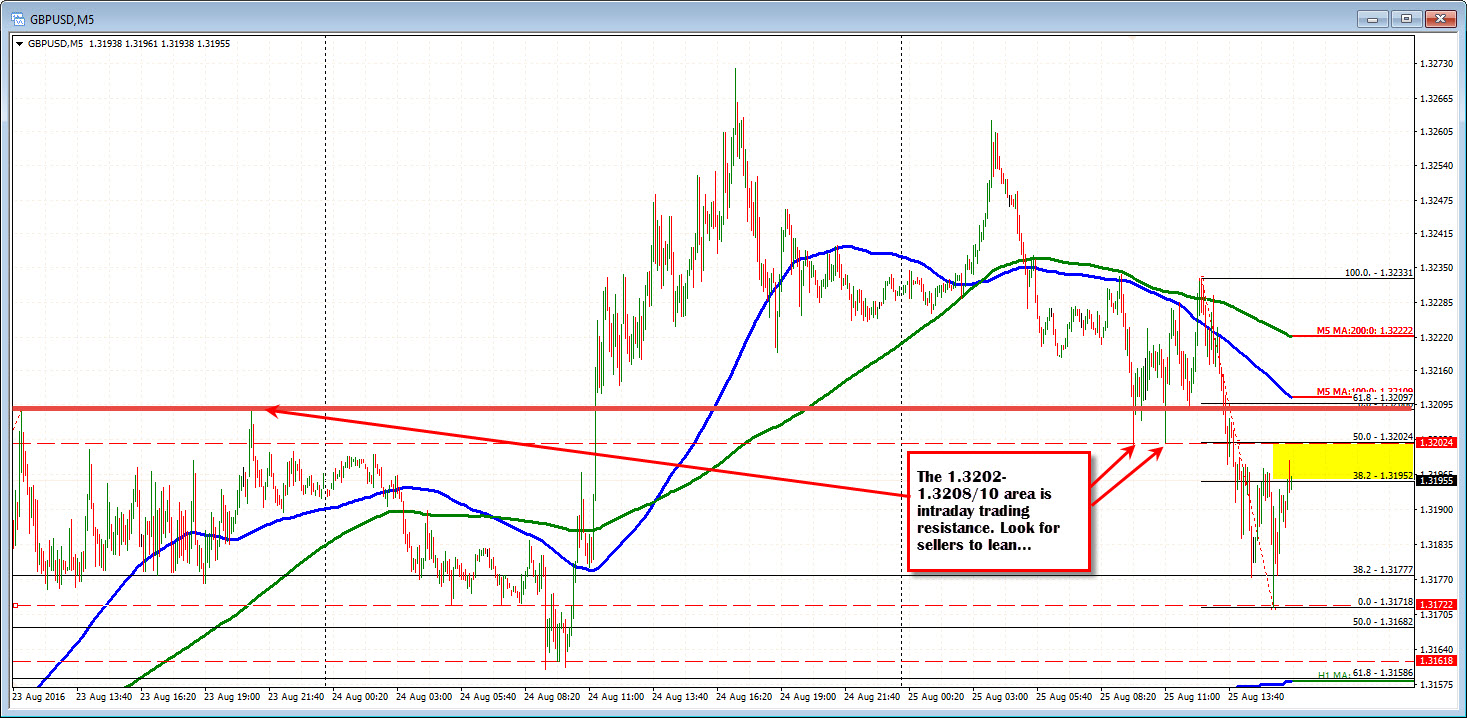
Looking at the 5-minute chart we know the dip buyer leaned at the 1.3172 level But overall, the price action is still down today. What would be more bullish? What would give the buyers against the support greater satisfaction (they are in against the lows afterall)? For me watch 1.3202. That is the 50% of the last move lower an the 1.3210. Those were highs from Tuesday, the 100 bar MA on the 5-minute chart will be there soon, the 61.8% of the last move lower comes across in that area too (see chart below). The cluster of resistance should even attract some sellers. The buyers in the low 1.3170s may be the ones who put the lid on it there. Look for a stall/ with stops above.