
Did it reach it's corrective peak?
The GBPUSD is lower today. Is it Carney? Is it the Reuters poll saying change is in 2017? Technically, the pair teased the buyers with moves above the 200 hour MA yesterday and again today (green line in the chart below), only to have the buying ultimately dry up and selling to take charge.
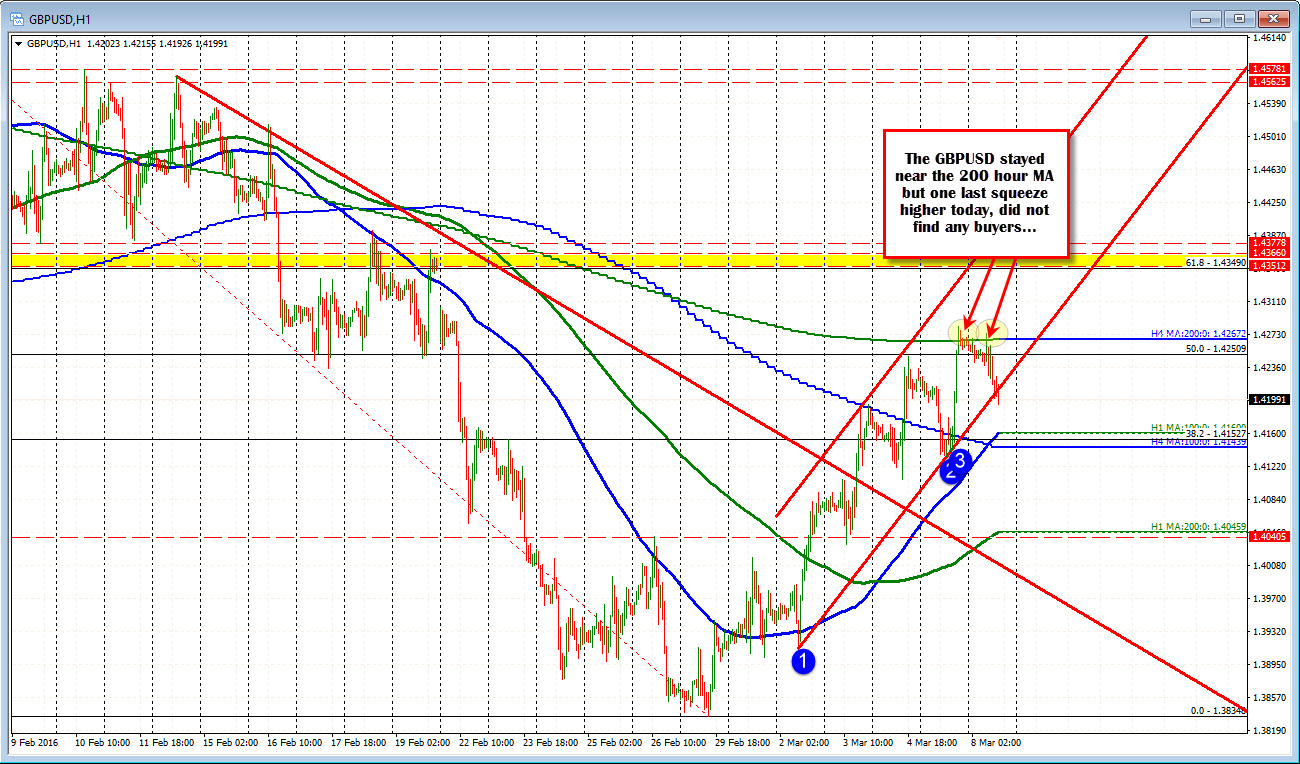
The pair has made it's way below the trend line at 1.4210. The 100 hour MA is at 1.4160. The 1.4200 level is providing some cause for pause. In this corrective move higher we have seen corrections similar to this one. There was a correction against the 100 bar MA on the 4-hour chart last Thursday. THere was the correction off the 50% test on Friday and into Monday. Today, it is the test of the 200 hour MA.
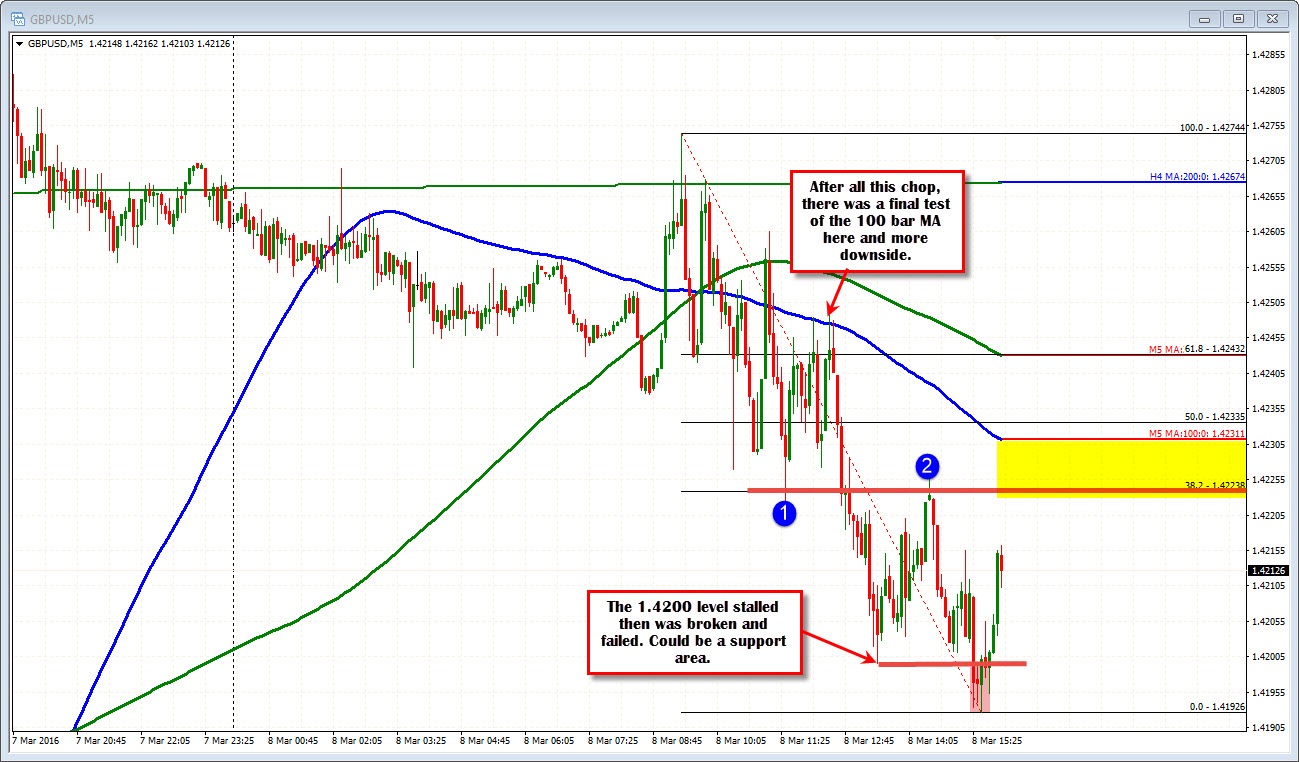
The trend line break is now seeing the price move back above the line at 1.4210 - trading at 1.4216 currently. the 38.2% of the move lower today comes in at 1.4223, the falling 100 bar MA comes in at 1.4231 (see chart below). Shorts from above today would like to see that area hold the line. Otherwise traders might feel less excited about the downside prospects...Shorts will also like to see 1.4200 broken and stay broken.
PS EURGBP is on a bit of a run higher as well today with Friday's high at 0.7772 and the 200 hour MA at 0.7788 the next targets (trades at 0.7767 currently). It is helping the GBPUSD - to the downside that is...

