
Trend line cuts across at 1.2661.
What is there technically for the GBPUSD now that is is sinking even further and further into multi decade lows.
The answer is it is more difficult. Thirty plus years ago, I was even young.
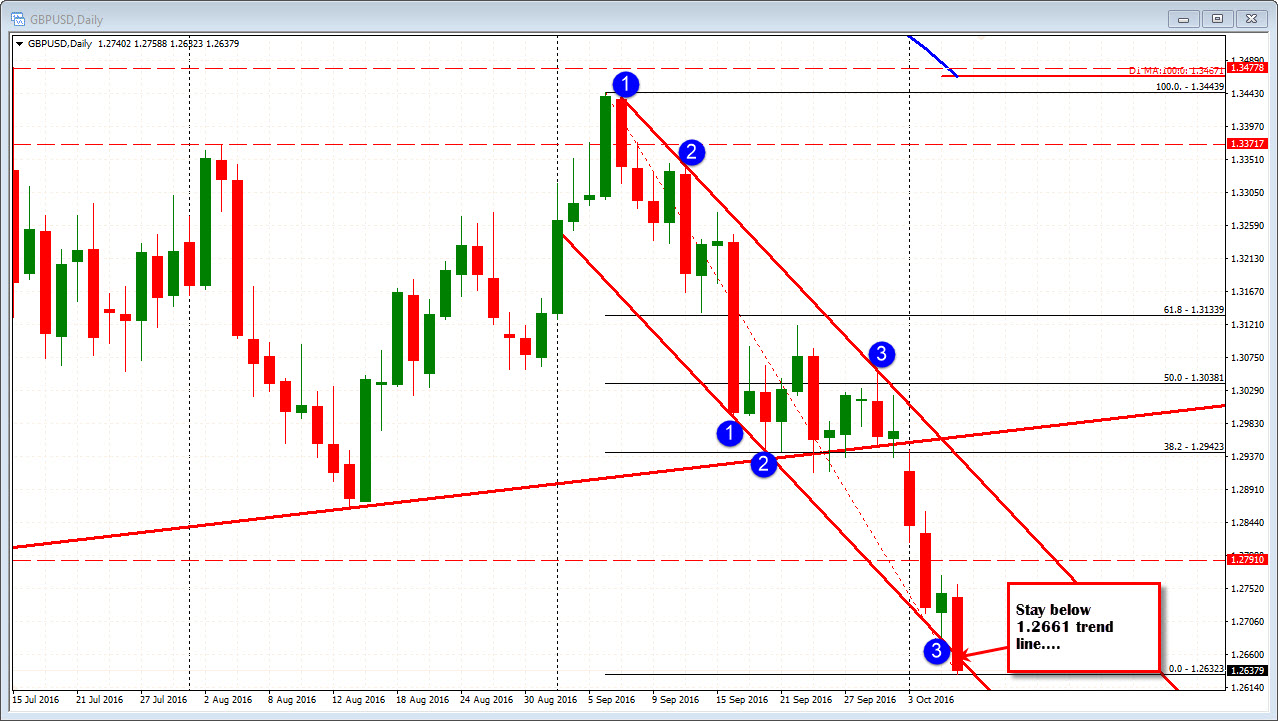
But what I do know is that the bottom channel trend line on the daily chart was broken (see chart above). So that access a risk defining resistance level. Stay below and the sellers remain in control. Move above then there may be some covering. It may be temporary but it is a flash light in the bearish darkness for the bulls. Above that the low from yesterday at 1.26845 is resistance now.
Looking at the hourly chart, connecting recent lows has the next target at 1.2615 and below that the underside of a broken trend line comes in at 1.2592 currently (both lines are moving lower).
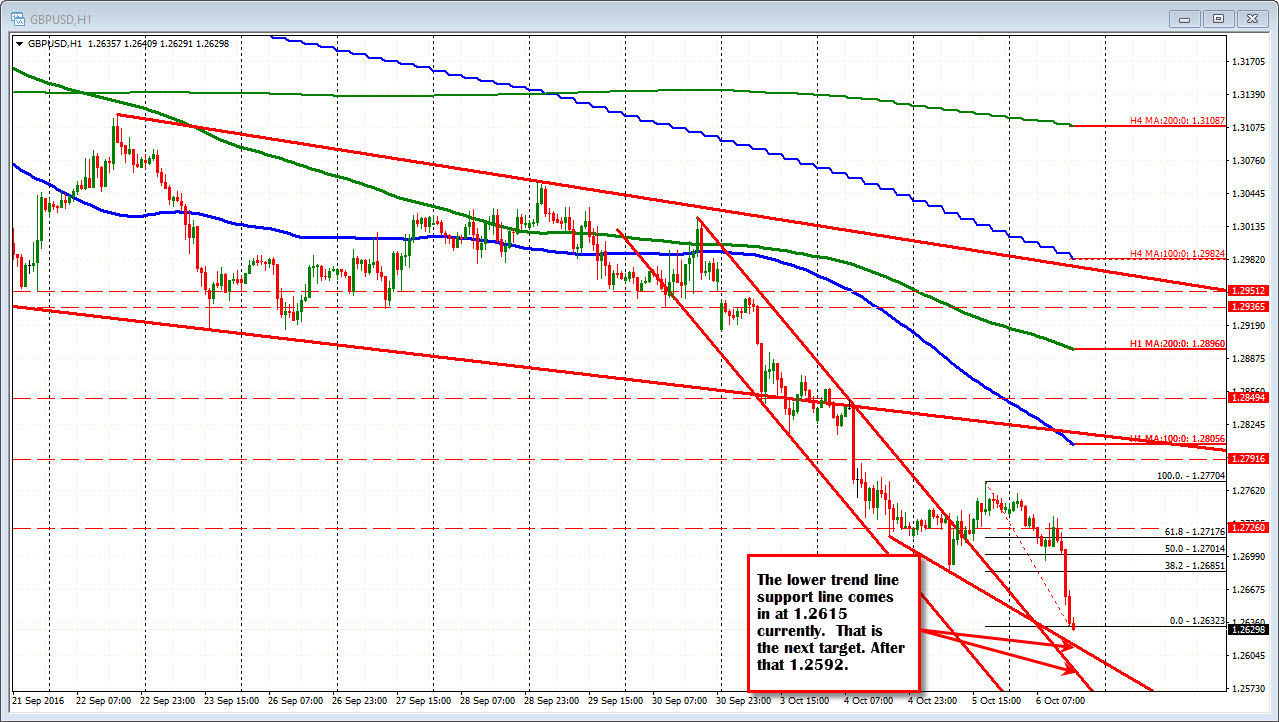
The sellers are in firm control. The targets are steps along the way that traders can use as a stepping stone. If you are rock climbing, you look for something to grab onto that will advance you higher, in this case, the rock wall is going down but those levels seem like the most obvious cracks to shoot for as the price moves lower and lower.

