Line in the sand = 1.5592
The GBPUSD has had volatile couple of days.
Yesterday the pair rallied on the back of much better retail sales out of the UK. Today the pair is back down on the US CPI data.
It takes two to tango in a currency pair and the GBPUSD is one which has been pushed around. When the stories are coming from the same direction in different countries, whichever was last takes precedence.
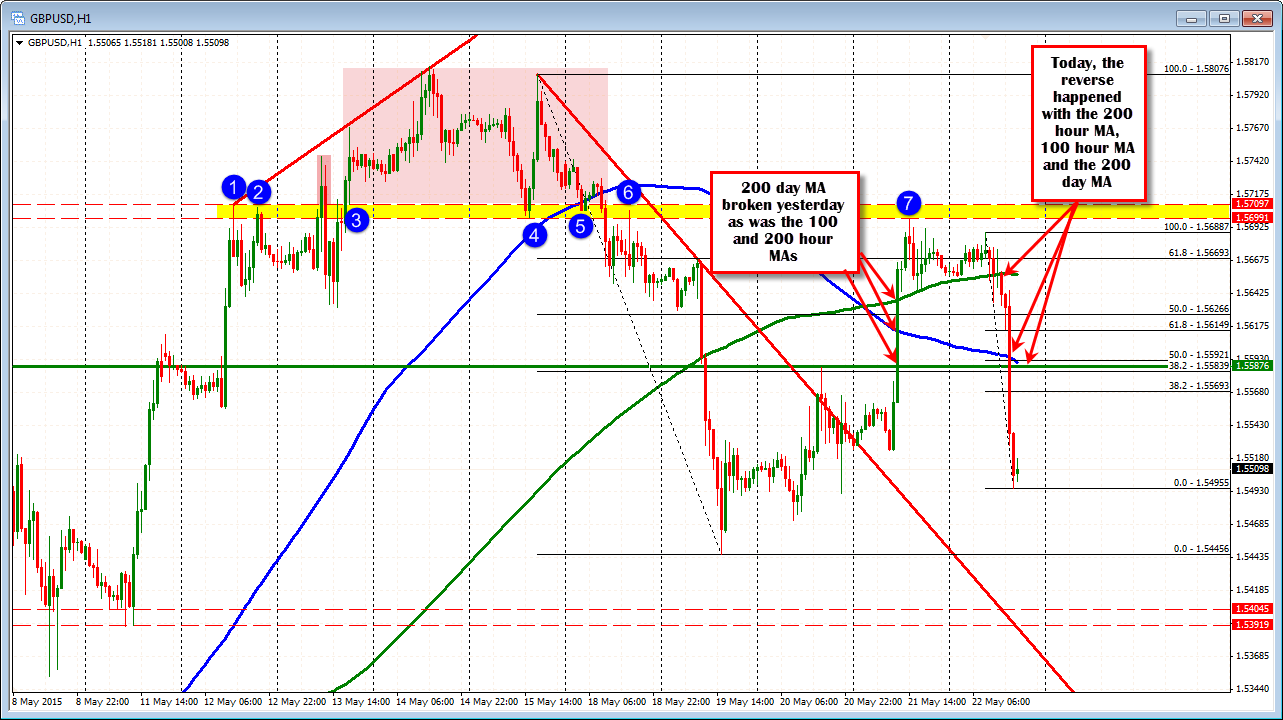
Technically, the last two days has seen the price move above technical levels on the upside. Looking at the daily chart, the 200 day MA was broken yesterday at the 1.5587 level as was the 100 hour MA and the 200 hour MA (blue and green lines in the chart above). Today, the reverse happened. The 200 hour MA was broken followed by the 100 hour MA and the 200 day MA (the 200 day MA is the green horizontal line in the chart above at the 1.55876 level).
What do we know from that chart now?
1. The price is near the low extreme from after the FOMC meeting minutes. That low came in at 1.5491. The low today 1.54955. If we are going lower, that level needs to be broken.
2. There is a nice "line in the sand" at the 1.5584-92 area. Why? The 200 day MA is at 1.55876. The 100 hour MA (blue line) is at 1.55908 (currently). The 50% of the move lower today is at 1.5592. The 38.2% of the move down from May 15 high comes in at 1.55839. Wednesday's high was capped at the 200 day MA level as well.
Are there any closer resistance areas?
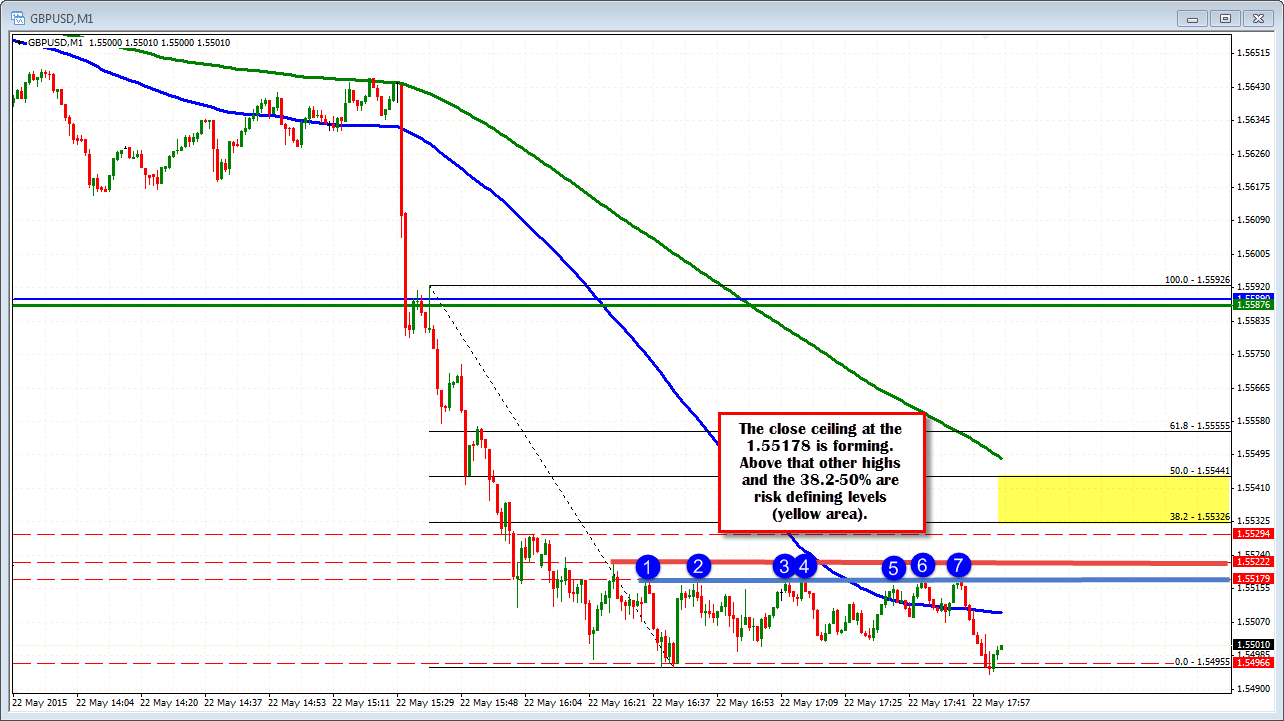
Looking at the 1 minute chart (I look at that as the 5 minute shows little corrective action on the way down), the pair fell sharply consolidated for 6 minutes with a high at 1.55926, and then fell sharply to 1.54955. The high corrections have stalled at the 1.55179-1.5522 area (see chart below). The 38.2% -50% of the move lower from 1.5593 comes in at 1.5532-44. These would be closer risk levels for traders.
PS. the pair is making new lows, so adjust the Fibo move to the new lows. At at low of 1.5485, the 38.2-50% comes in at 1.5526-39 now.