Up by 4.2% or 559 pips today.
The GBPJPY has rallied about 900 pips over the last few days. For the week the pair closed at 130.13 on Friday and the high today extended to 139.45. That is 932 pips.
What a run, or is it?
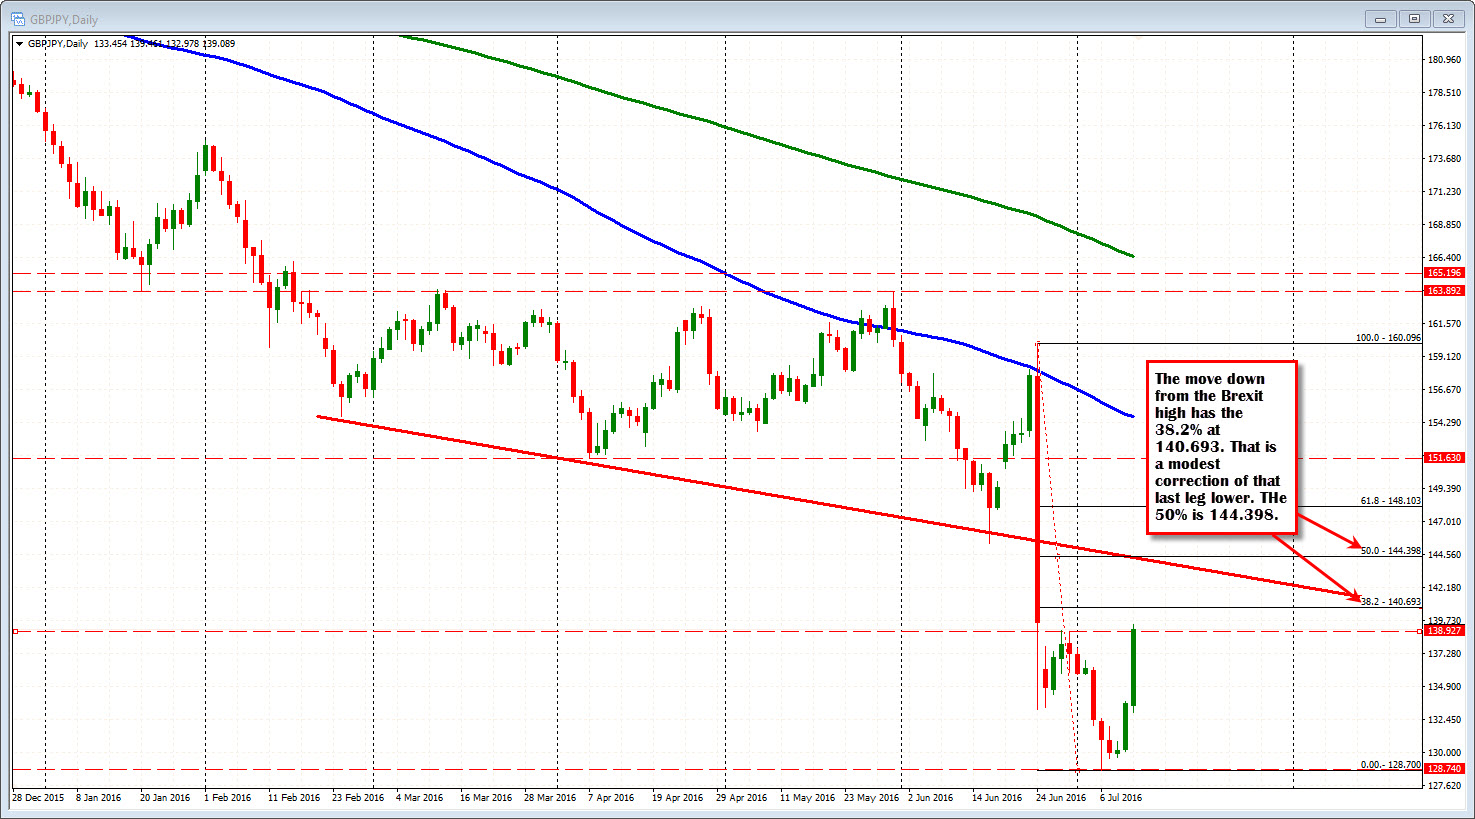
If you were to look at the move down from the Brexit day high (at 160.096) to the low on July 6th (last Wednesday low at 128.70, the retracement has yet to make it to the 38.2% retracement at 140.69. We traded as high as 144.03 on Brexit day. The 50% of the same move down comes in at 144.398. The high today reached 139.46.
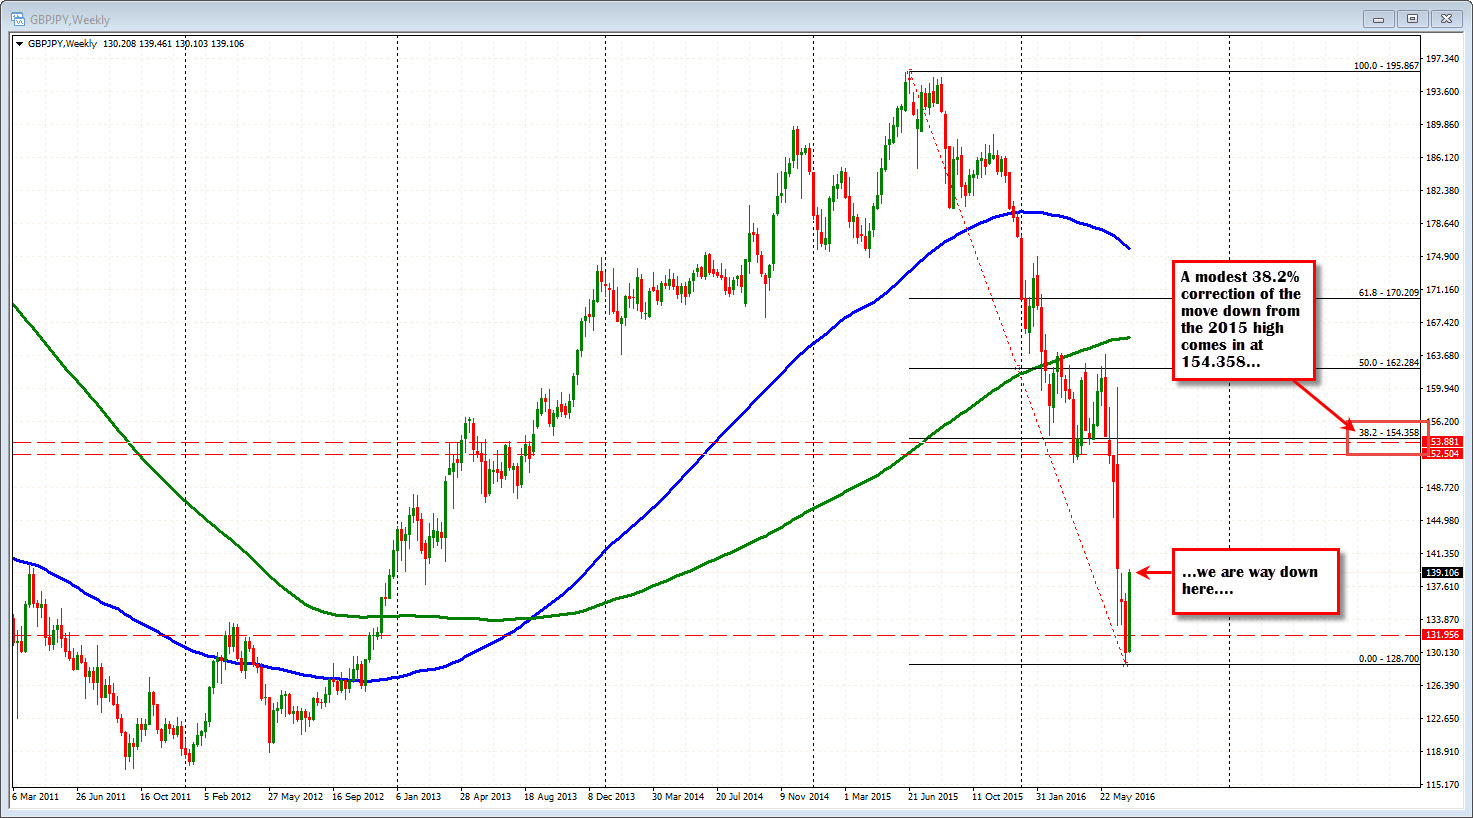
If you go back to the 2015 high of 195.86, the 38.2% of that move come in at 154.358. I am not saying we go there, but given a sharp fall like we experienced with the Brexit, the corrections can be quite material - quite large. A 38.2% retracement is not out of the question and it still keeps the longer term bearishness.
So why not just buy now....sell later?
Well...we have gone 900 pips. There can be brutal corrections lower as well. It is not a easy trade as fear is likely to be quite high. As soon as you hit the buy, you will likely be thinking "I bought the high".
So if the horse has left the barn and you want to hop on a trend as there is the potential to roam even higher, look to buy a correction.
Does that mean buy a 38.2% correction of the near 1000 pip move higher? If the low was oversold and the pair deserves to be higher, we may not get close to that on a correction. Trends are fast, directional and tend to go farther than traders expect. Will those looking to trend the market wait for the 38.2% of 1000 pips? Probably not.
Instead... what I like to do and tell traders is to buy a correction of a trend leg.
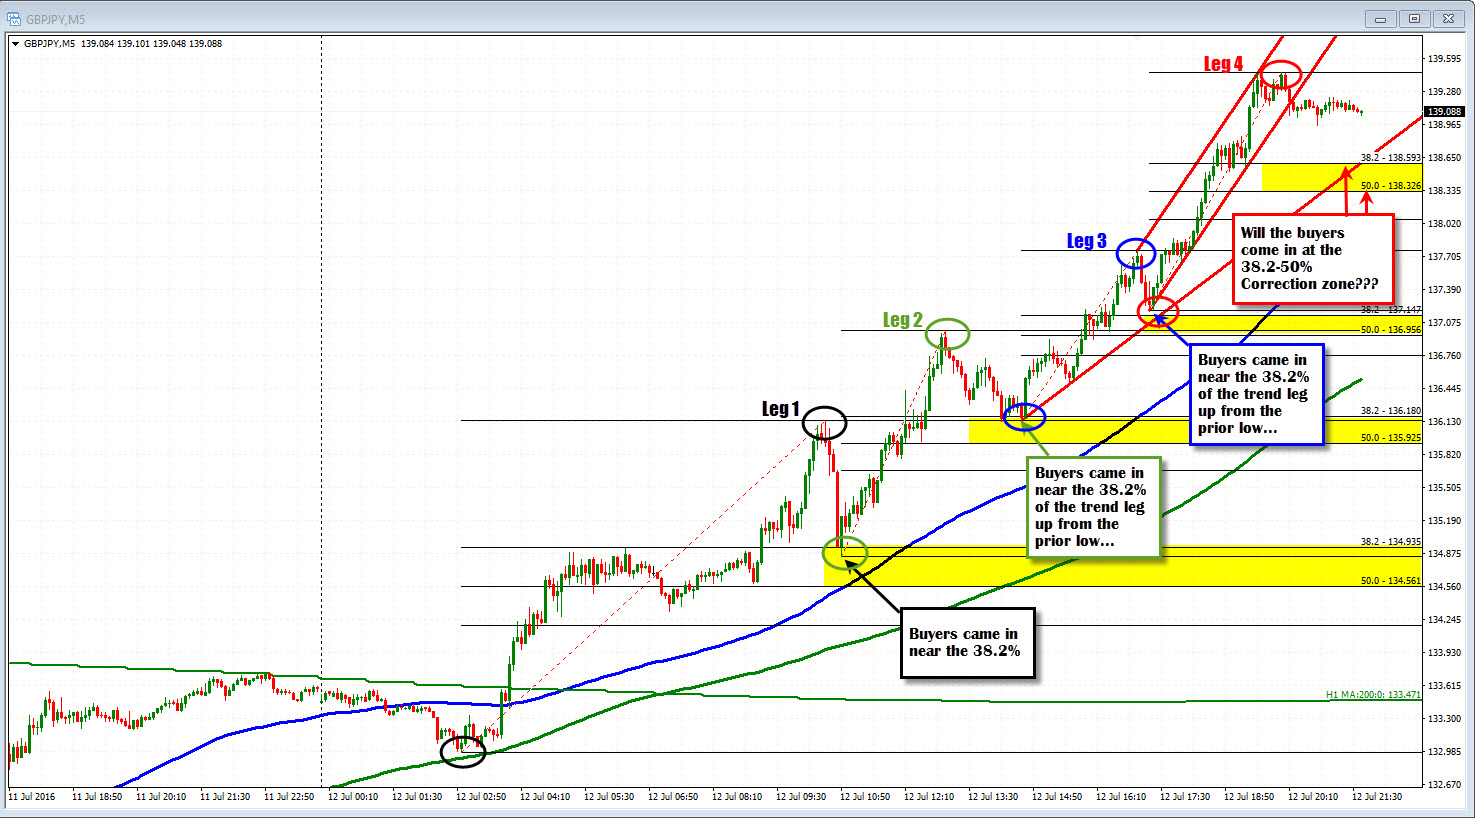
Below is the 5 minute chart of the move higher today. I have outlined the 38.2-50% of the different trend legs higher today. They are the yellow areas. In the chart there are 4 legs. A leg is when the market trended and then corrected. The legs have to be fairly significant to qualify. The smallest leg on this chart is 161 pips.
Note where the buyers come in on the corrections? In each case, right around the 38.2% retracement. That is indicative of a strong trend. Buyers on dips are aggressively buying at the 38.2% of a trend leg - not the entire move - but just a trend leg.
Now we are currently in the 4th leg higher and the price has "sideways" into a break of the last trend channel. The 38.2%-50% of the move higher comes in at 138.32-59. The sideways action is showing a tired market. We are moving toward the close. There may be some profit taking.
So traders in the pair who want to hop a trend, might want to wait and see if there is a further drift to the yellow area and lean against it to get onboard. It may not hold support but at least risk is defined and you are not paying the top. You will only lose a little.
If it does hold and the trend does continue toward 140.00, 144.00 or beyond, you bought a low risk dip, can control your fear, and are on the trend. That is what traders who are late to the trend should strive to do.
By the way, if you feel it has gone to far and you are looking for a move lower, guess what you need to see the price move below? The same yellow correction zone area defined by the 38.2%-50% of the last leg higher. That is the minimum correction you need to get to and through to show the sellers are taking back control. IF they cannot, the sellers are not taking back control and the buyers remain in control.