
Breaks below the support levels. They now become resistance
The USDJPY has broken lower and is trading at new session lows as I type. From a technical perspective the price has moved to the lowest level since October 2014. In that month, the price corrected lower from 110.00 to 105.19. We sit more toward the middle of that range. There is not a lot to grab onto on the downside. There is a minor swing low at 107.60, but that is not all that great level. So instead of targeting targets, it sometimes makes sense to find levels above that should keep a lid on it. What do I see?
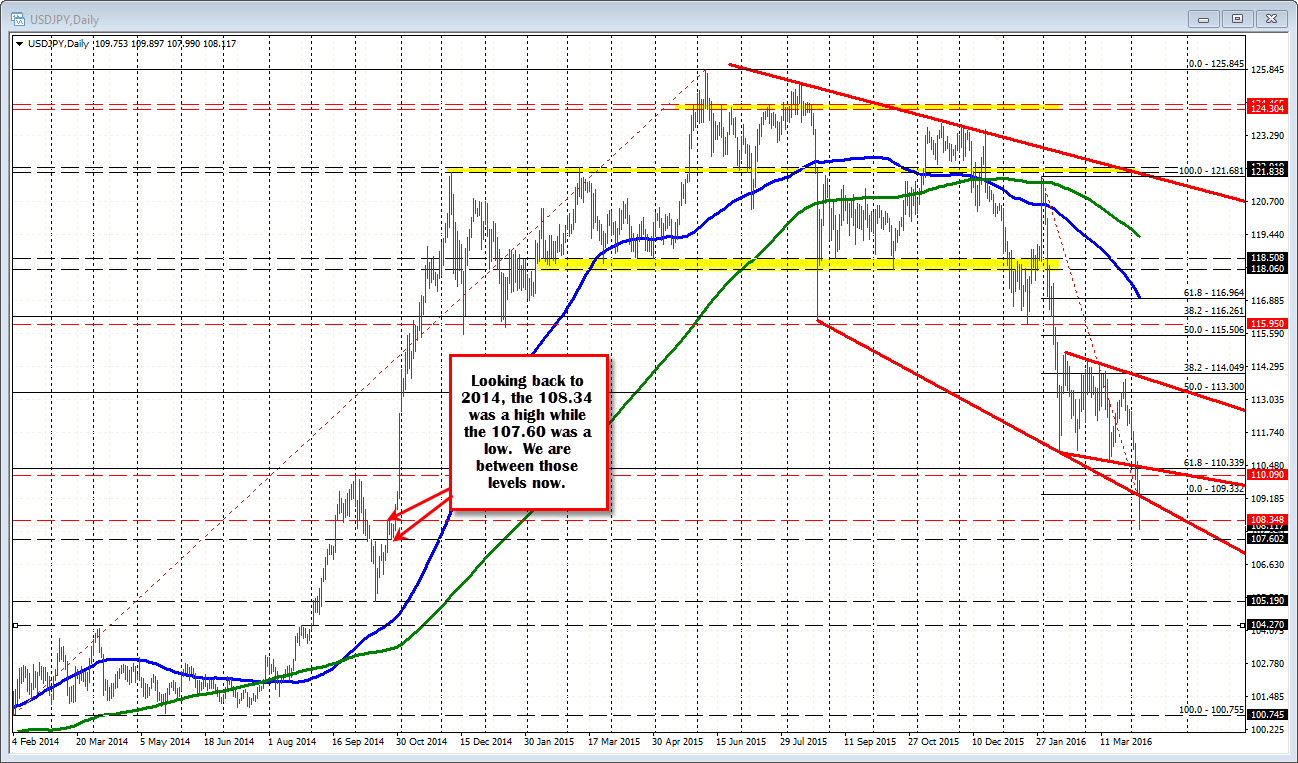
Looking at the chart above the 108.34 was a swing high in the midst of the push higher at the end of October 2014. That is one level to stay below. What else?
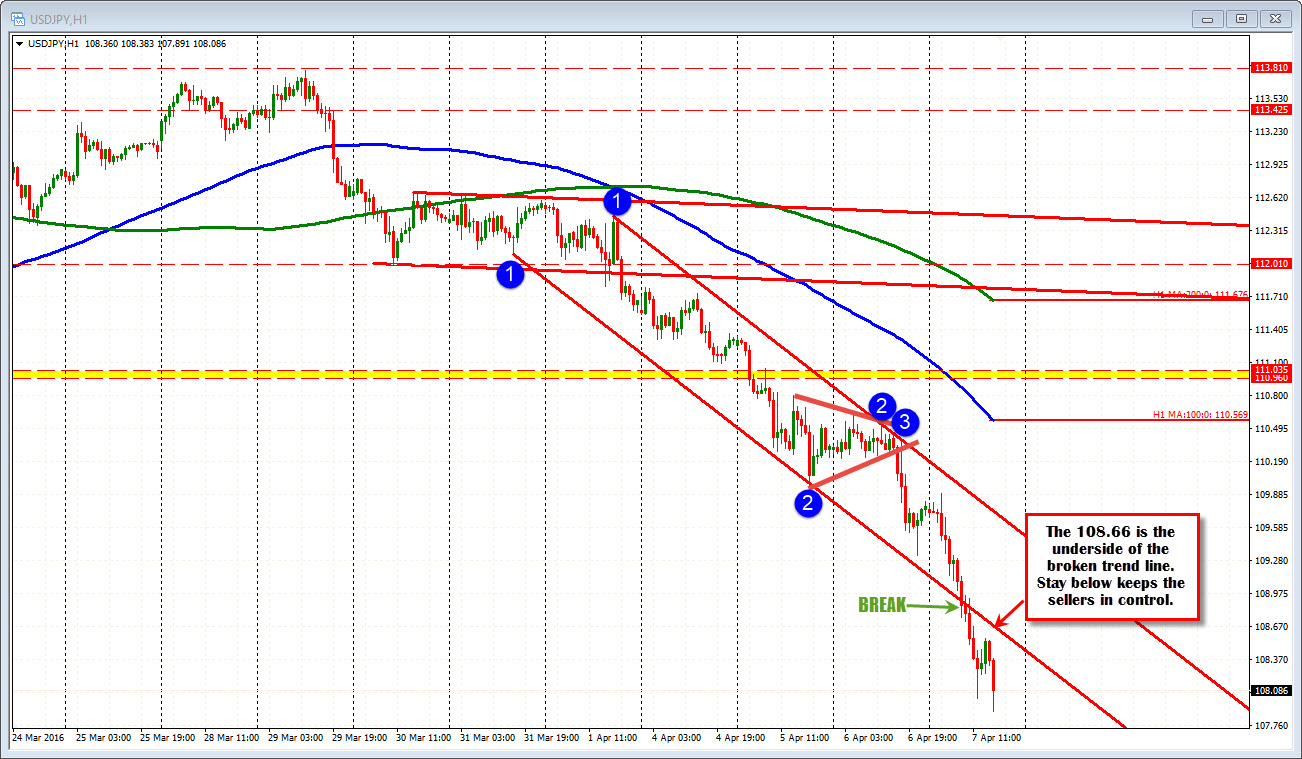
On the hourly chart, the price today has accelerated the downward momentum below a lower channel trend line. That trend line comes in at 108.66 currently but it is moving lower each successive hour, so that too will be a level to stay below. WHen the price accelerates a trend move, it goes get into oversold territory but you have to respect the trend. So until the price trades above the level, the bears remain in control.
The final chart that we can look at is the 5 minute chart. That shows the pair trending lower in trading today. There was a break below a lower trend line that led to a bearish wedge retracement. The price has broken lower - moving below the 108.00 in the process. The topside trend line now comes in at 108.34. The 100 bar MA on the chart is at 108.48. Both are moving lower and will be levels to get above if the buyers are to take back control.
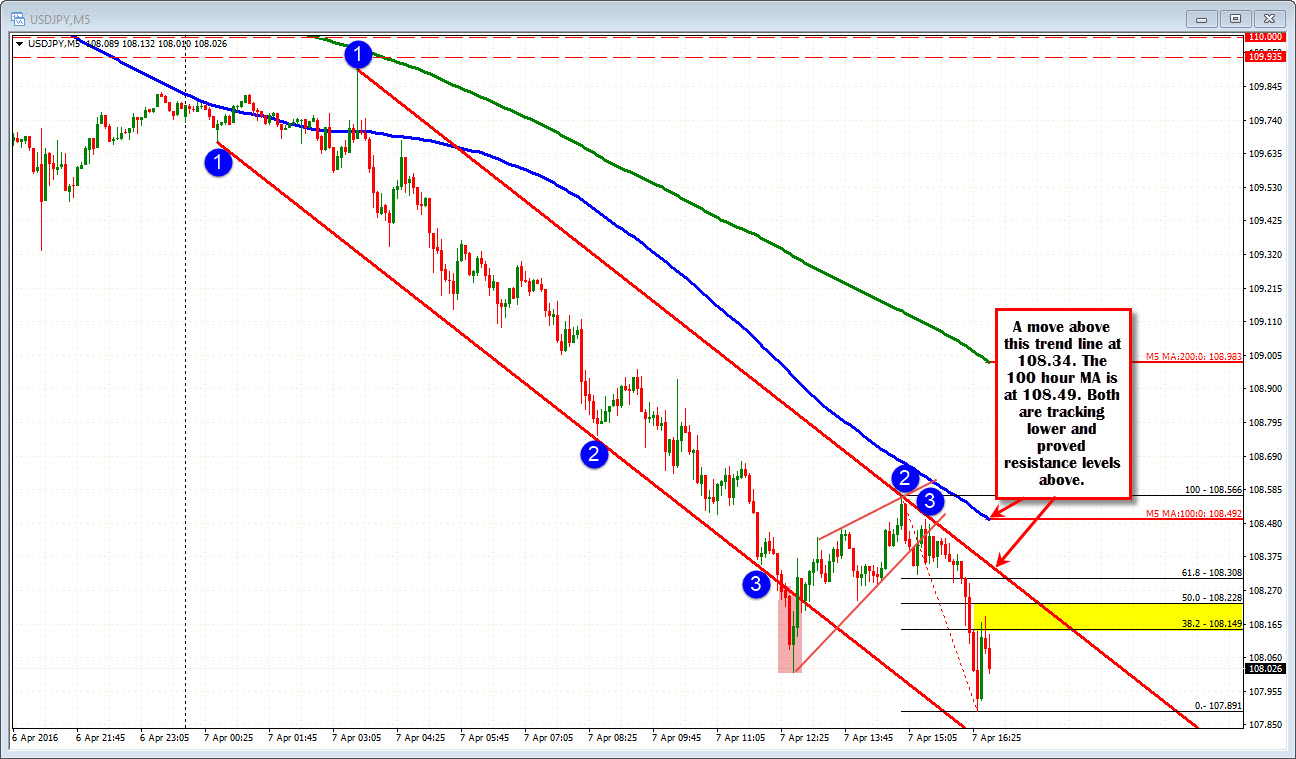
Overall, the bears are in control in the pair. The quick rebound back above the 108.00 level may give traders a reason to buy against the 108.00 level but it will take a move back above the 108.34, 108.48 and 108.66 to help turn the tide more to the upside for the pair - from a technical perspective that is.....

