Rally stalls
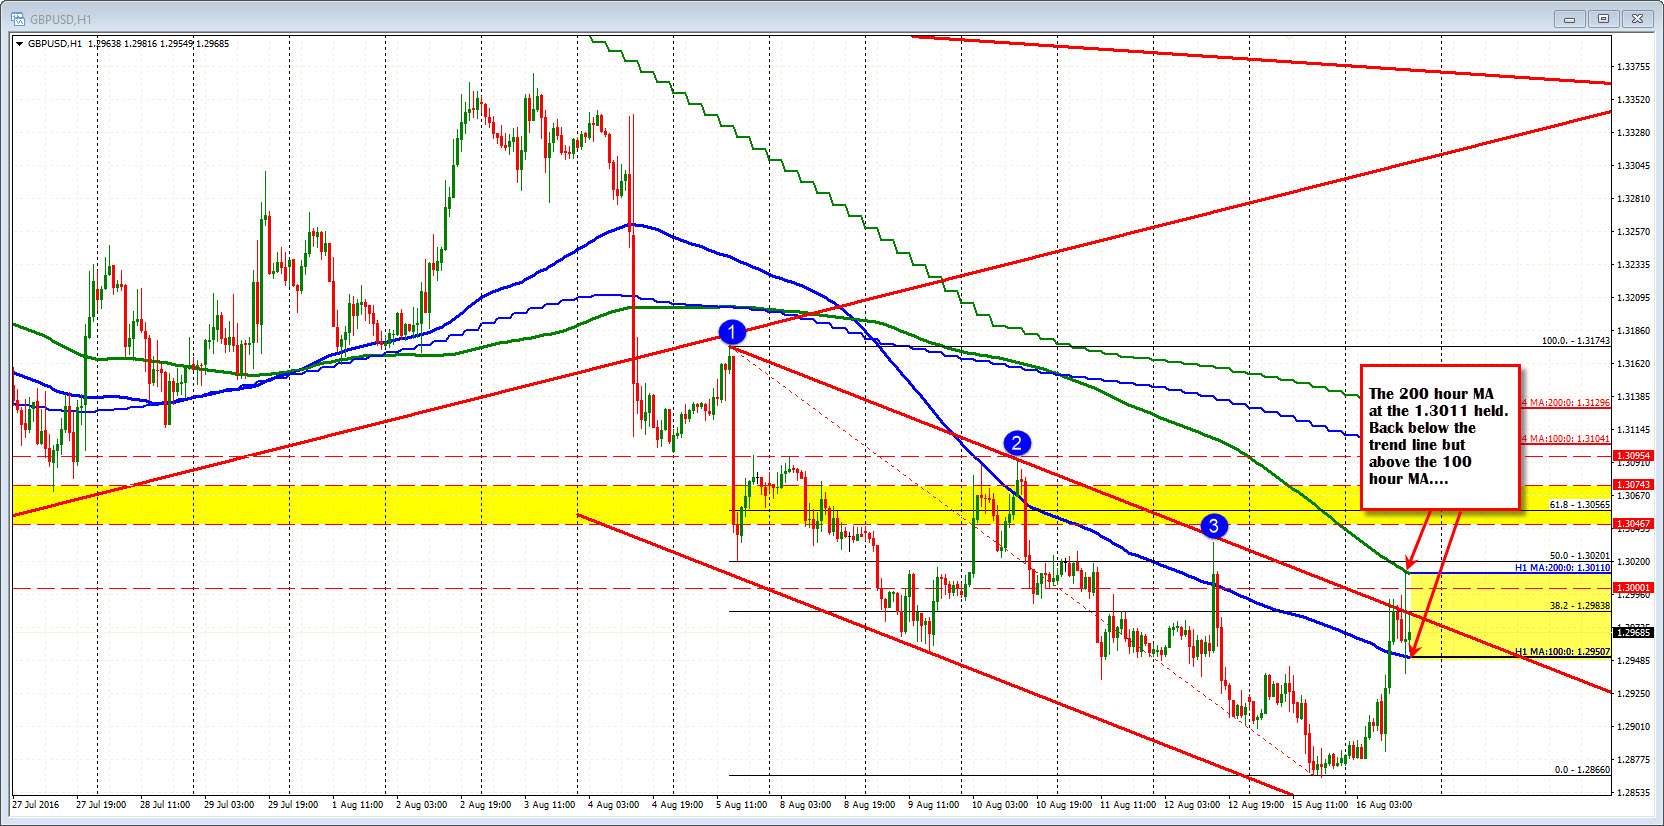
The rally in the GBPUSD stalled against the 200 hour MA (green line in the chart below) and the 50% of the move down from the US employment day corrective high from August 5th. The move lower has come down to the 100 hour MA (blue line) and we are seeing more two way action as the markets settle (the 100 hour MA is at 1.29508 currently). Keep an eye on the 1.2983 area. That level is the 38.2% of the same move lower and the underside of the broken trend line. The currently hourly bar, has stalled against that line. Often, a trend line is broken and fails. Traders will then re-establish the line as a level to lean against.
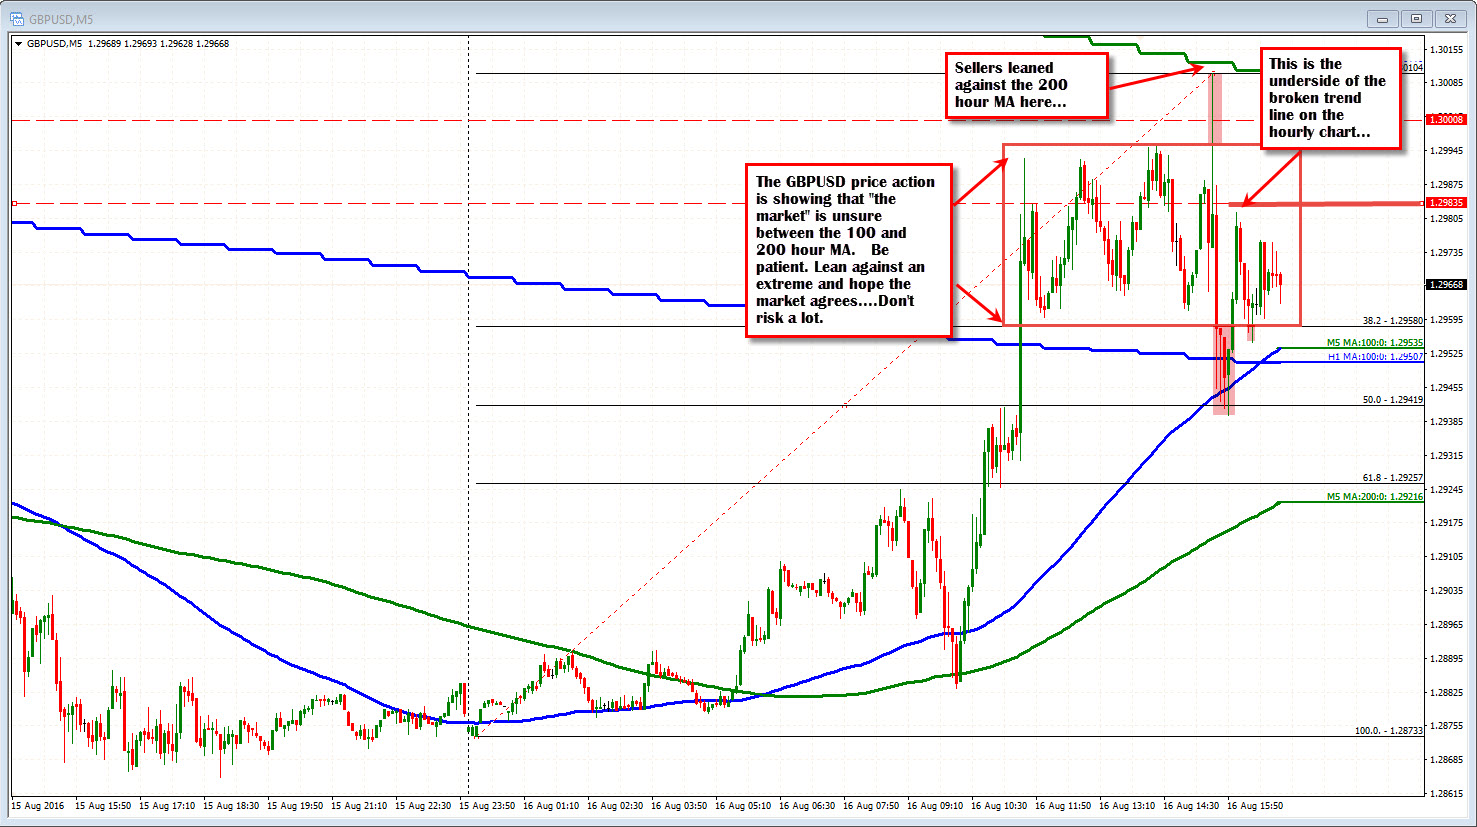
Looking at the 5-minute chart shows more up and down energy. That says to me to be patient. Pick your spot to trade. If it works, great. If it does not, don't fight it. The price action is a bit two pay between the MA levels. You want to trade an extreme where risk is low/limited.