Moves further away from the 100 day MA
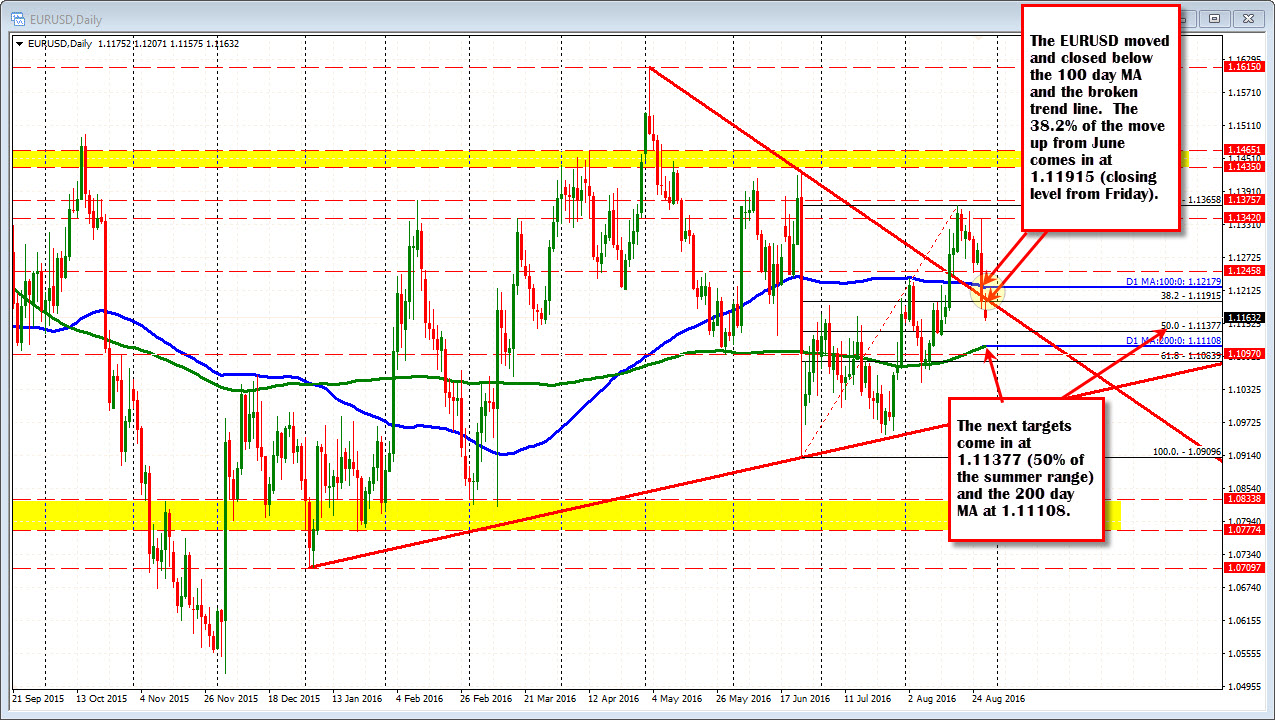
The EURUSD fell sharply on Friday and in the process fell and closed below the 100 day MA at the 1.12178 level. The pair also closed back below a broken trend line on the daily chart (see chart below). It closed right at the 38.2% of the move up from the June low at 1.1192 area.
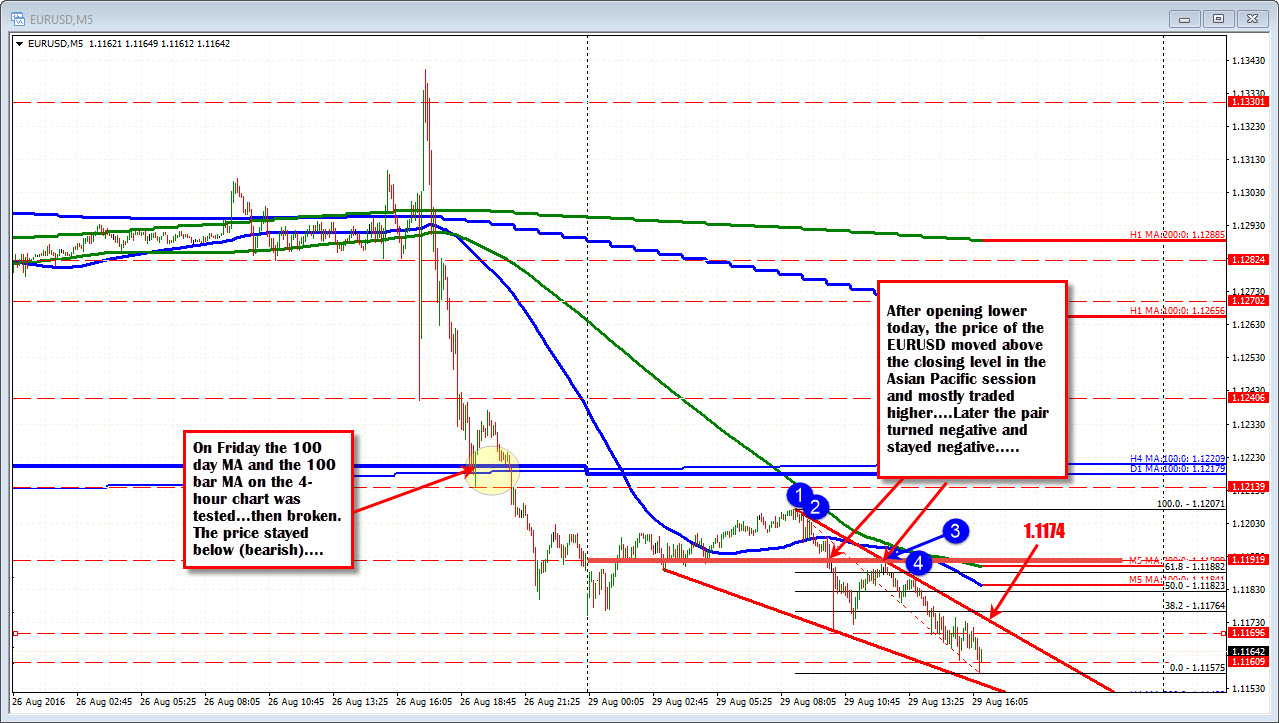
The price action today (see chart below) showed a lower opening, followed by a corrective move higher into the European morning hours. The correction higher stalled and once the price moved back to negative on the day (at 1.1192 area - see RED horizonal line on the chart below), the price remained negative on the day (see 5-minute chart below).
Intraday the upper trend line on the price action today comes in at 1.1174. The 38.2-50% retracement comes in at 1.1176-823. The 100 bar MA (blue line in the chart above) is moving toward those levels and should act as resistance on a corrective move. Patient sellers can look for sellers at this area today. A move above will muddy the water for the day and the downside -at least temporarily).
Stepping back and looking at the daily chart below, the 50% of the move up from the June (can we call it the summer low), comes in at 1.11377. The 200 day MA comes in at 1.11108. Those will be the next major targets on the bearish run.
PS not shown but the midpoint of the years range is 1.11628. That is where we are trading now.