
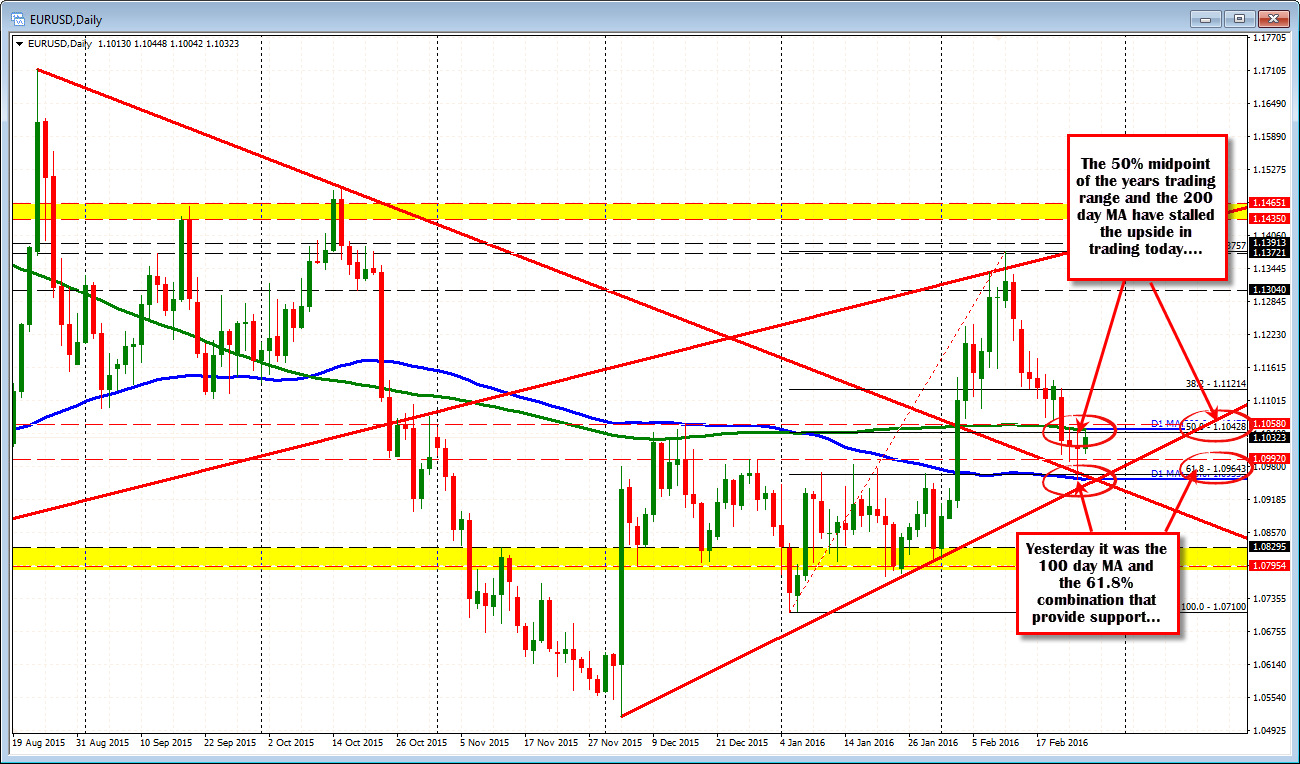
200 day and 50% of the years range provide a ceiling above
Yesterday the pair held the 100 day MA/61.8% retracement held support. Today the 200 day and midpoint of the years range is providing a ceiling. The 50% midpoint comes in at 1.10428. The 200 day MA comes in at 1.10475 today. The high for the day stalled at 1.10448 - between the two levels.
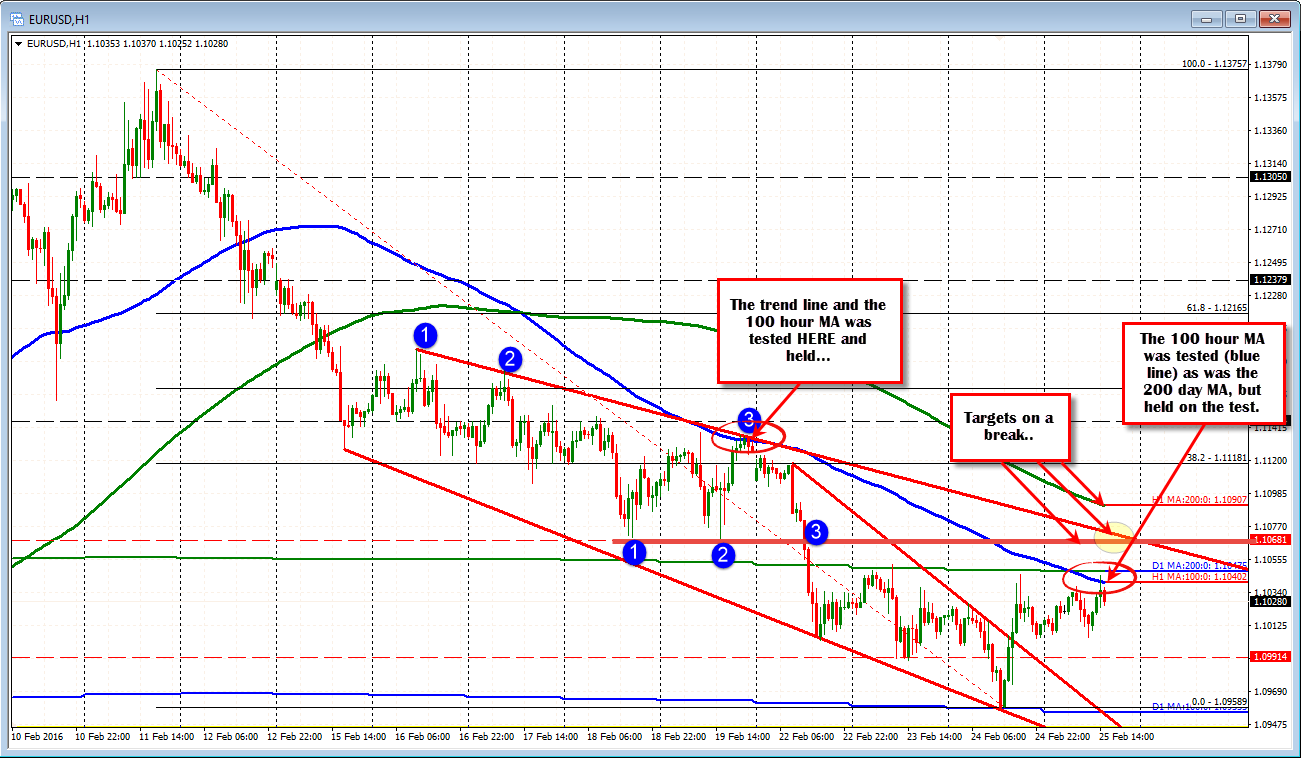
Looking at the hourly chart below, the 100 hour MA is also providing upside resistance. That MA comes in at 1.10402 currently (see blue line in the chart below). The high today did move above that MA, but with the overhead resistance from the daily chart, it did not go very far above. The price fell below the 100 hour MA back on February 12th - tested the MA line on February 19th - but continued the downside momentum.
If there is a break, there should be some stop momentum higher. The next target would come in the 1.1066-73 where there are swing lows from Feb 18/19 and the downward trend line cuts across (at 1.1073 currently). Above that, the 200 hour MA will be in play at 1.10906.
On the downside, the pair is now testing the 50% midpoint of the day's trading range and the 100 bar MA. The 200 bar MA on the same chart is at 1.10209. A move below that certainly muddies the water even more.
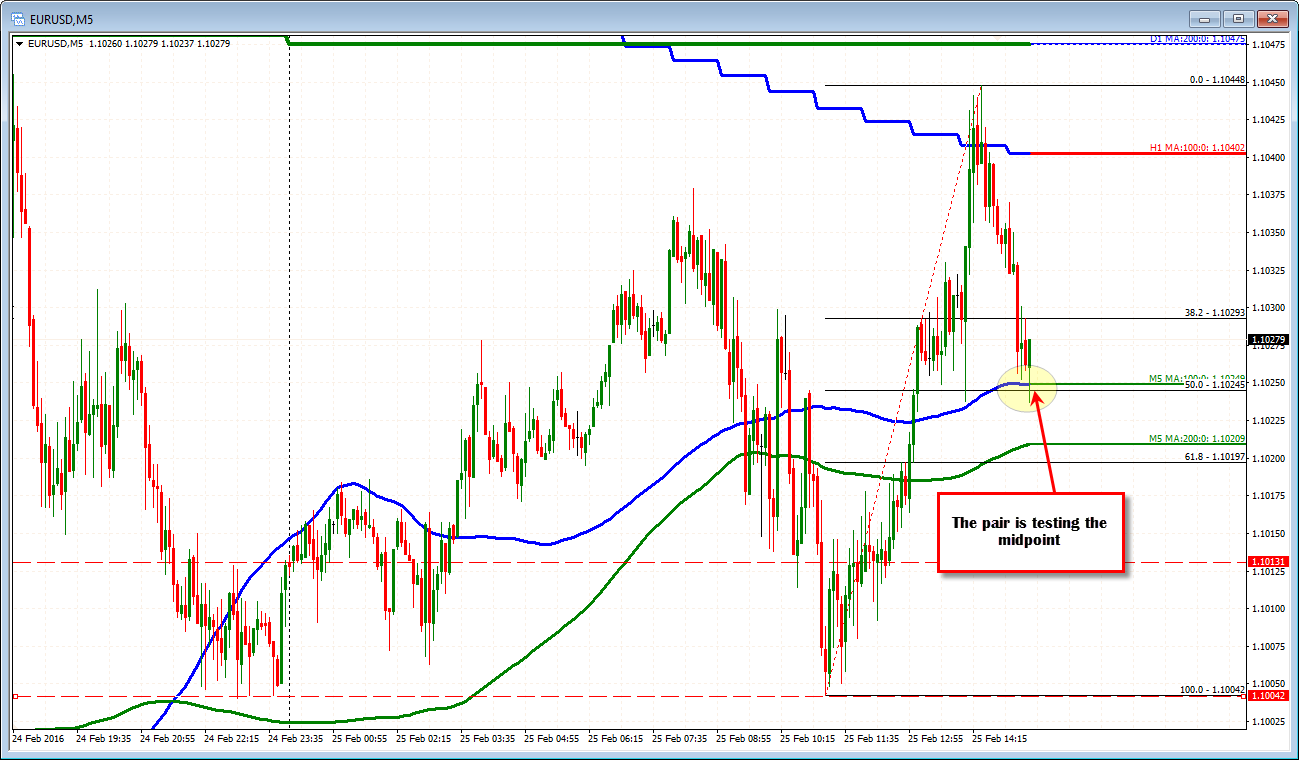
We might just have a case of the ping-pongs between key resistance above and key resistance below...

