Above extreme high
The EURUSD moved above what has been the extreme high area I have earmarked since the end of June.
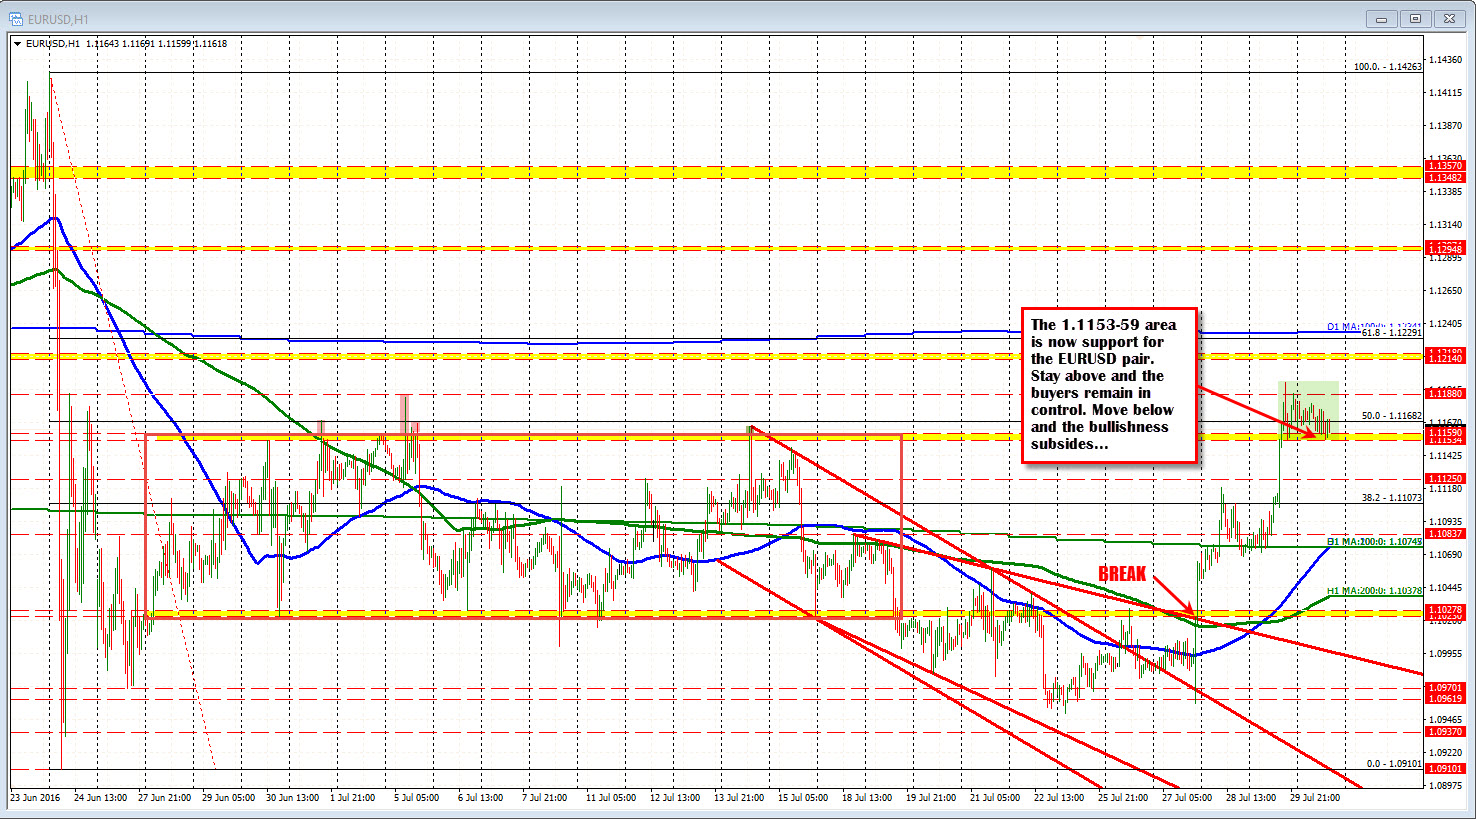
Looking at the hourly chart above, the 1.1153-59 level set swing highs on June 30 and July 4th. On July 1 and again on July 5th there were failed moves above that area. Each were were quickly rejected. That happened again on July 14 with another failed break (was UK rate decision day).
Looking at the red box in the chart above (from June 28th to July 19), most of the trading activity was below the 1.1153-59 area. ON the downside, the 1.1023-27 level was support. From July 19 to July 27th, the pair tried to explore lower levels but momentum faded.
The break back above the 1.1023-28 level late Wednesday (last week) turned the sellers into buyers. ON Friday, weak US GDP gave the pair the extra push above the topside extreme area at 1.1153-59. Note that the correction low - after the break above the yellow area - held 1.1153 on Friday and again today. That is key for me. Stay above and buyers remain in control. The market can explore higher. Move below and the market bullishness dulls a bit.
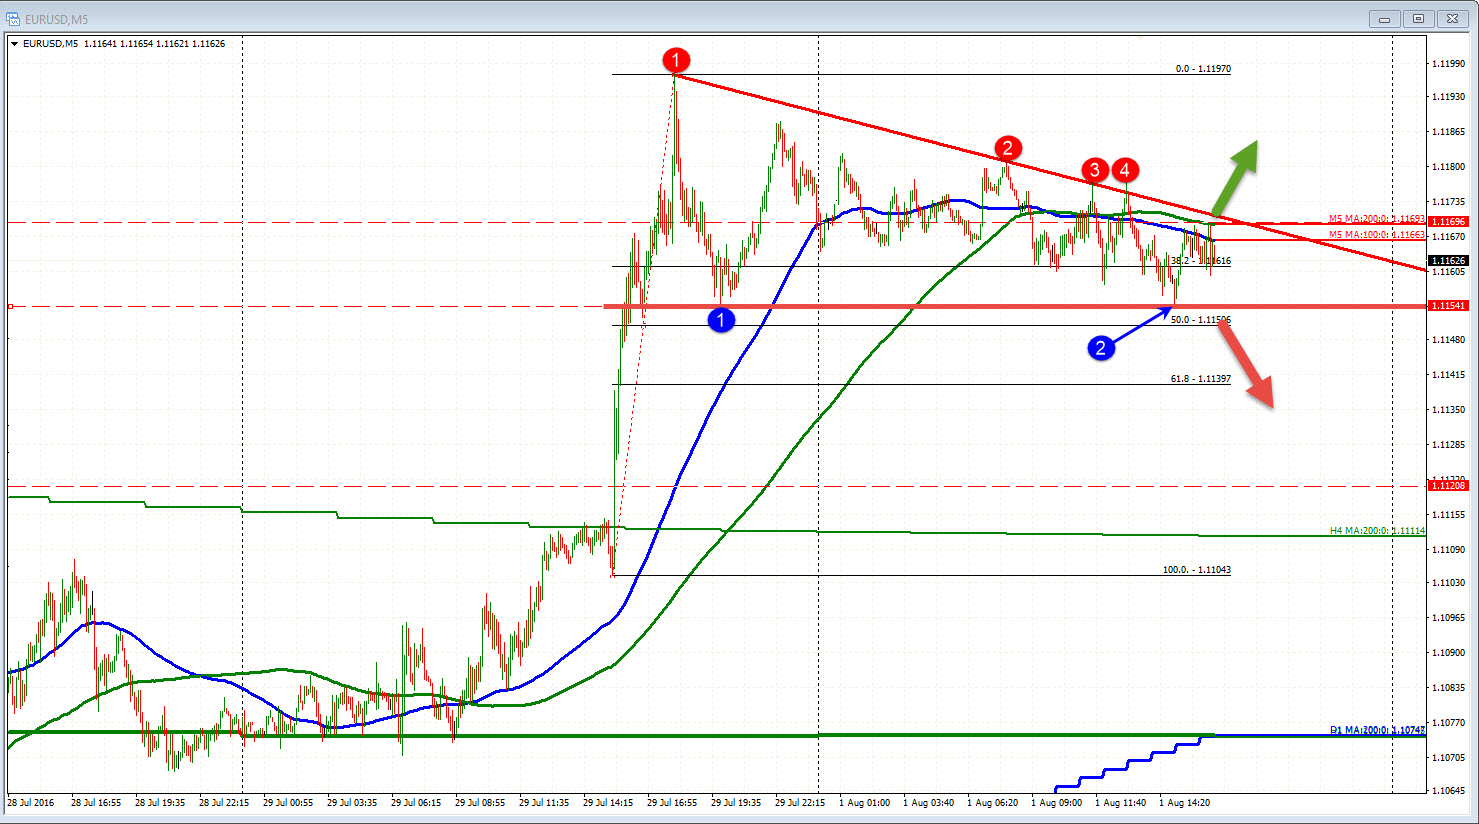
Drilling down to the 5-minute chart, you can see the support against the 1.1153 support level clearer. The low on Friday went down to the level and bounced. Today, the same low was printed and held. The correction off the low today has stalled against a topside trend line. Get above it and there should be a further push higher.
Manufacturing data is out soon. A weaker number will be eyed by the buyers to push the price above resistance. A stronger number what may take the pair below the support level and lead to a further correction move lower. With the range only 28 pips today, there is room to roam in either direction.