
Upper trend line holds
The EURUSD moved higher in Asian and early European trading. The high price peaked just above topside trendline resistance. Yesterday, the same thing happened (i.e, a small break and then reversal).
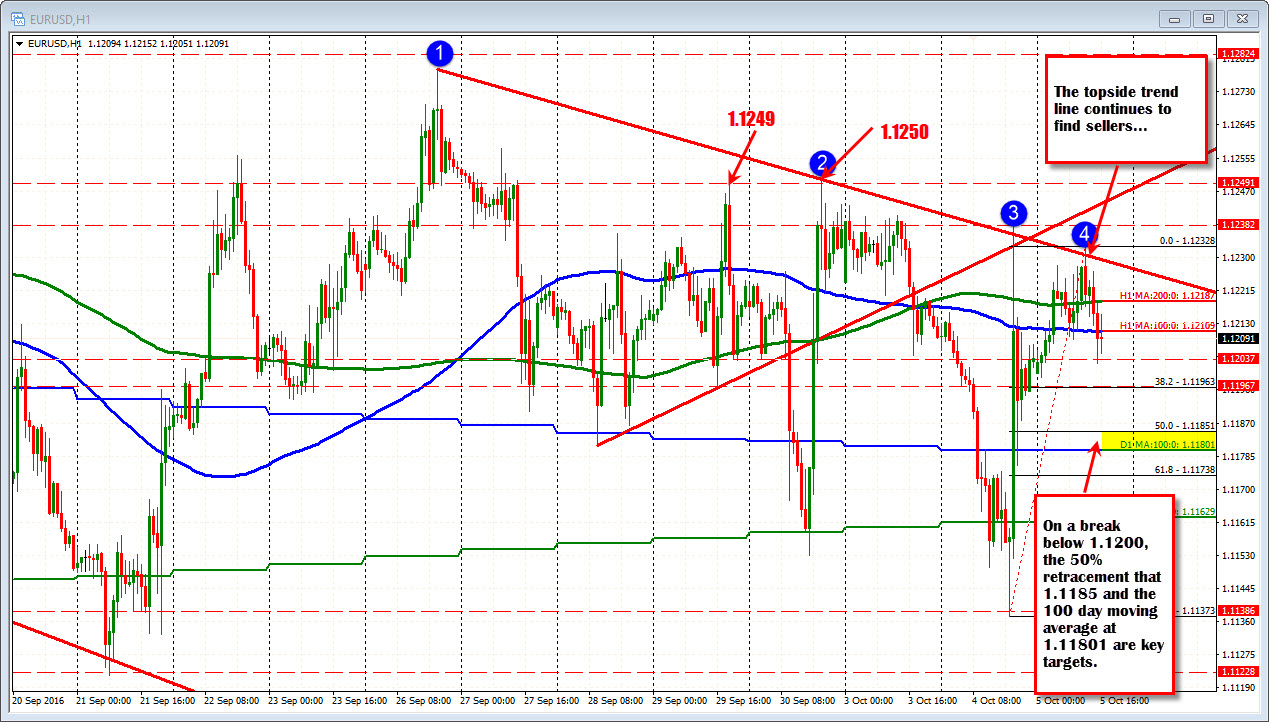
The wander back lower has taken the price back below the 200 hour moving average and the 100 hour moving average (green and blue lines in the chart above) at 1.12187 and 1.12110 respectively. The low corrective price has moved to 1.12025 - just above the 1.1200 level. The close from yesterday was 1.1204. PS the 100 week MA is at 1.1210 this week. Just saying....
When a big figure like 1.1200 holds you think options. However, according to Mike's option expiree report for today, there is not a lot of option expires at the level. Nevertheless, the big figure level can bring natural buyers into the market. Also traders will lean against the closing level (something about the close and +/- on the day). The combination may be the support target that needs to be broken if we continue to go lower today.
If we do break, the 1.1185 level is the 50% of the move up from the low yesterday and the 100 day MA is at 1.1180. The range today at 34 pips (the 22 day trading range average is 68 pips). So there is room to roam.
Of course we could also hold the support and move higher. A move above the 200 hour MA at 1.12187 would be more bullish intraday. The topside trend line and recent highs at 1.1233, 1.1238 and 1.1250 are all achievable targets.
Fed's Kashkari, Factory orders and ISM data will be released in the next 1/2 hour. The ISM Non Manufacturing index is expected to rise to 53.0 from 51.4 in September. The August factory orders are expected to fall by -0.2% versus a sharp gain of 1.9% in July. Ex-transportation last month came in at 0.2% (there is no estimate for this figure). Durable goods orders are expected to remain unchanged at 0.0% with ex transportation of -0.4%.
US stocks are opening higher with the S&P up 8.584 0.4% and the NASDAQ composite index up 18.62 or +0.35%

