Market is still choppy, like see water in a storm...
Speaking of storm, the winds of a crappy stock opening is looming in the USA as European indices are down large (like up to 3.5% down) and that has helped contribute to the choppy conditions. Sometimes, the flow of funds go the EURUSD way. Sometimes it does not. Trying to figure out "the story" can be hard at times. The market traders do seem to be looking at a chart and in the sea of up and down choppy, they see points where it might make sense to put a toe in the water. That is how I see it at least.
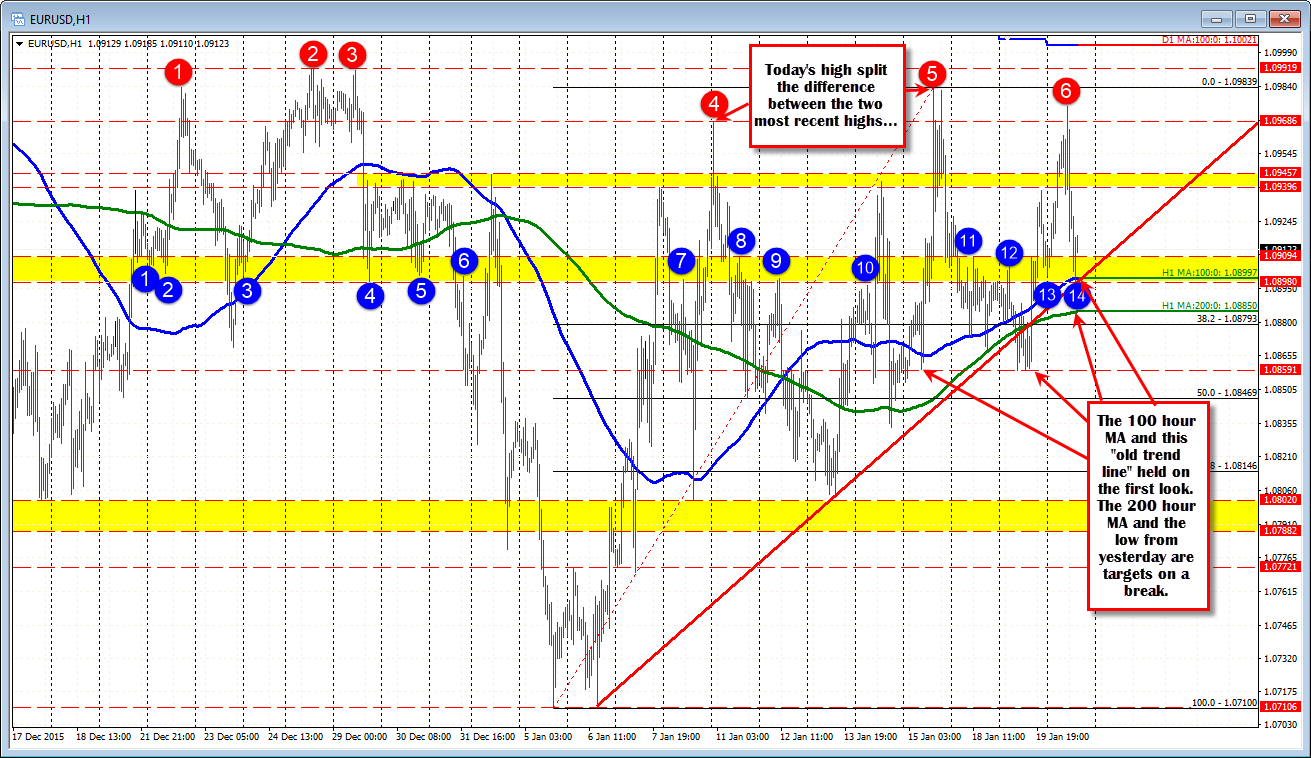
Today, at the beginning of the day (see hourly chart above), the price found support in the 1.0900-09 area where there have been a number of swing lows and highs. Yes, the market has moved through this area too (going back in time that is). It does that in a choppy market, but traders showed up and defined risk there (PS it helped to have the 100 hour MA - blue line - trend line and 200 hour MA - green line - near there to lean against too).
The price moved higher (in Asia Pacific session) but stalled between the last two swing highs (between 1.09686 and 1.09919. The high extended to 1.09755). You can see the hurdles at the highs - so does "the market". The price fell and where did it just stop? The 100 hour MA and the trend line and 1.0900-1.0909 area. The toe was put in the choppy water again. Is that area enough to hold the choppy water?. Does anyone really know? If it does it does. If it does not, it does not.
What we do know is a move below the level will not look so supportive (so risk is defined there). On a break lower, the 200 hour MA at 1.0885 looms. A move below that at the lows from yesterday and swing low from Friday at 1.0859 is the next target as the choppy conditions continue.
The range for the EURUSD is 79 pips. The 22 day average is 95.
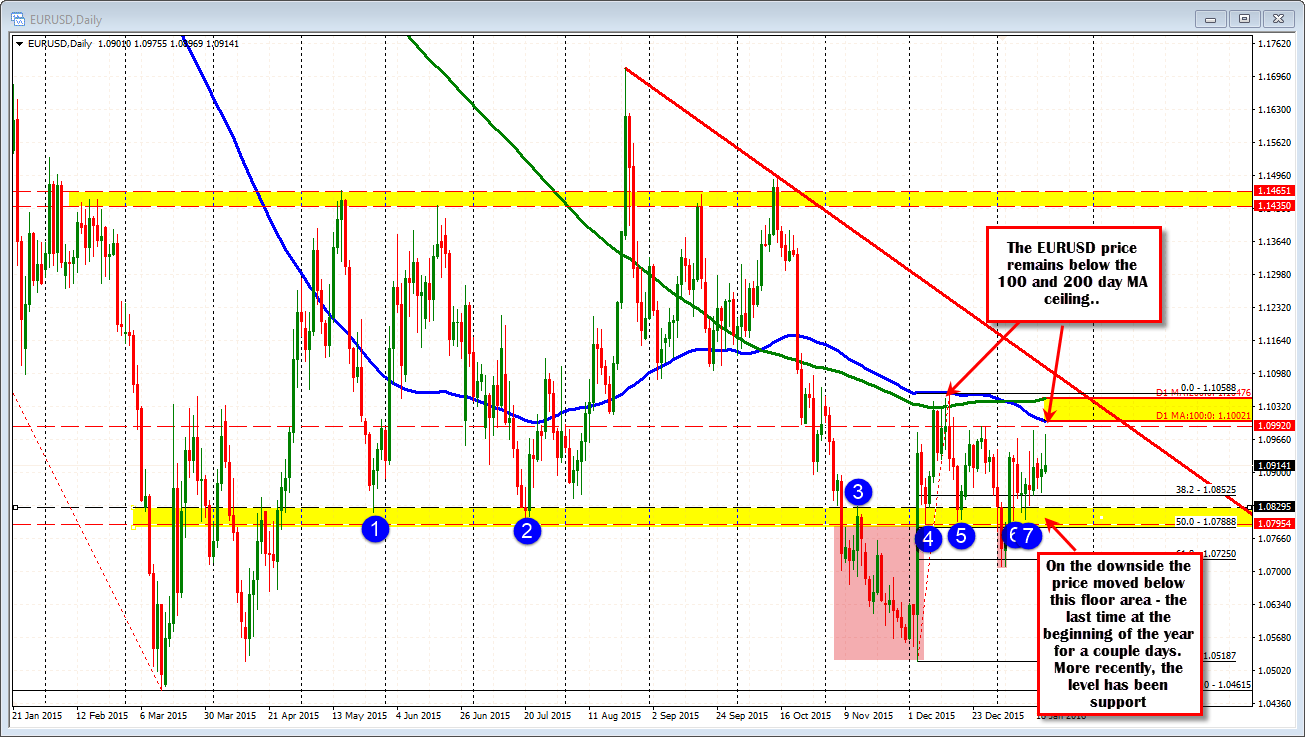
Looking at the daily chart, 1.0788-10830 has a number of swing lows/highs. A move below 1.0859 tracks toward that area. On the topside, the price stays below the 100 and 200 day MA (blue and green line).