
Making some sense of the EURUSD chop
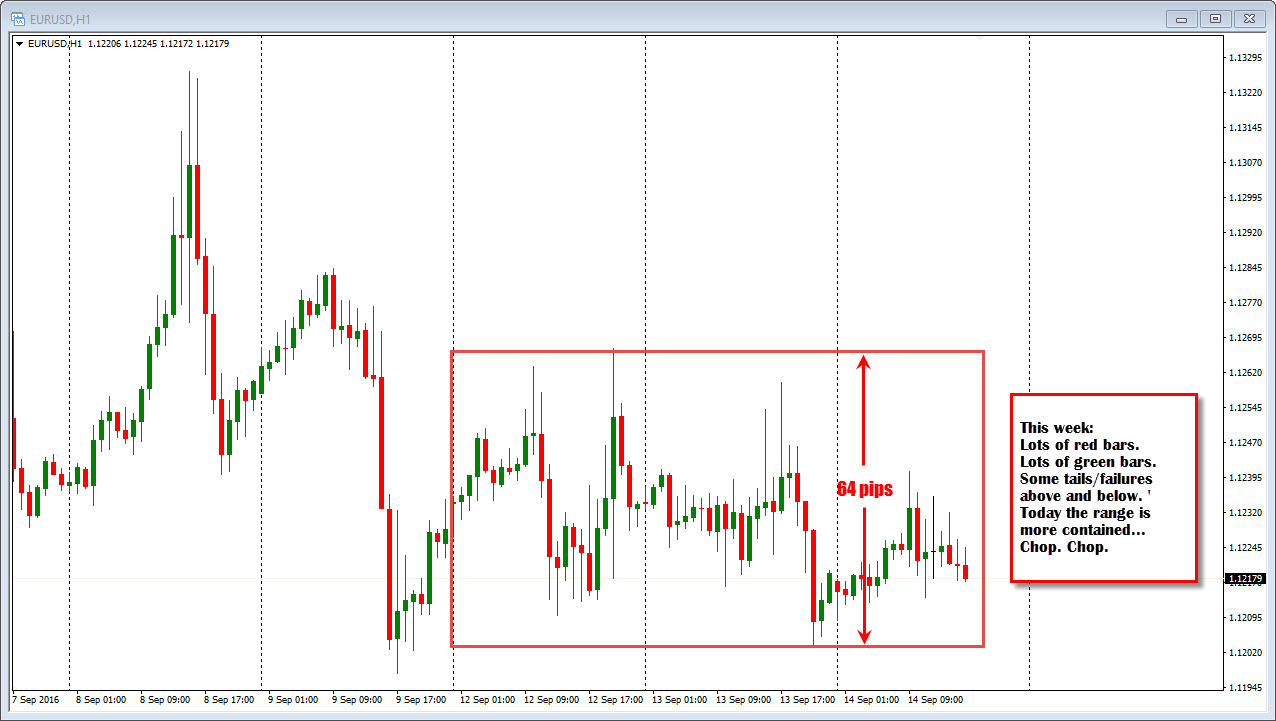
If you looked at the price action of the EURUSD through the first 3 days of the week you would see a bunch of red candles (down), and green candles (up). Some spikes and failures on the topside and the downside. Today the range is more confined but equally as choppy. Oh yea, the range is 64 pips in the midst of the ugly action. That is for the week. We are half way through the week.
Chop. Chop.
Is there anything from that chop that can tell us something? That could give us a trade?
Well, add some technical tools.
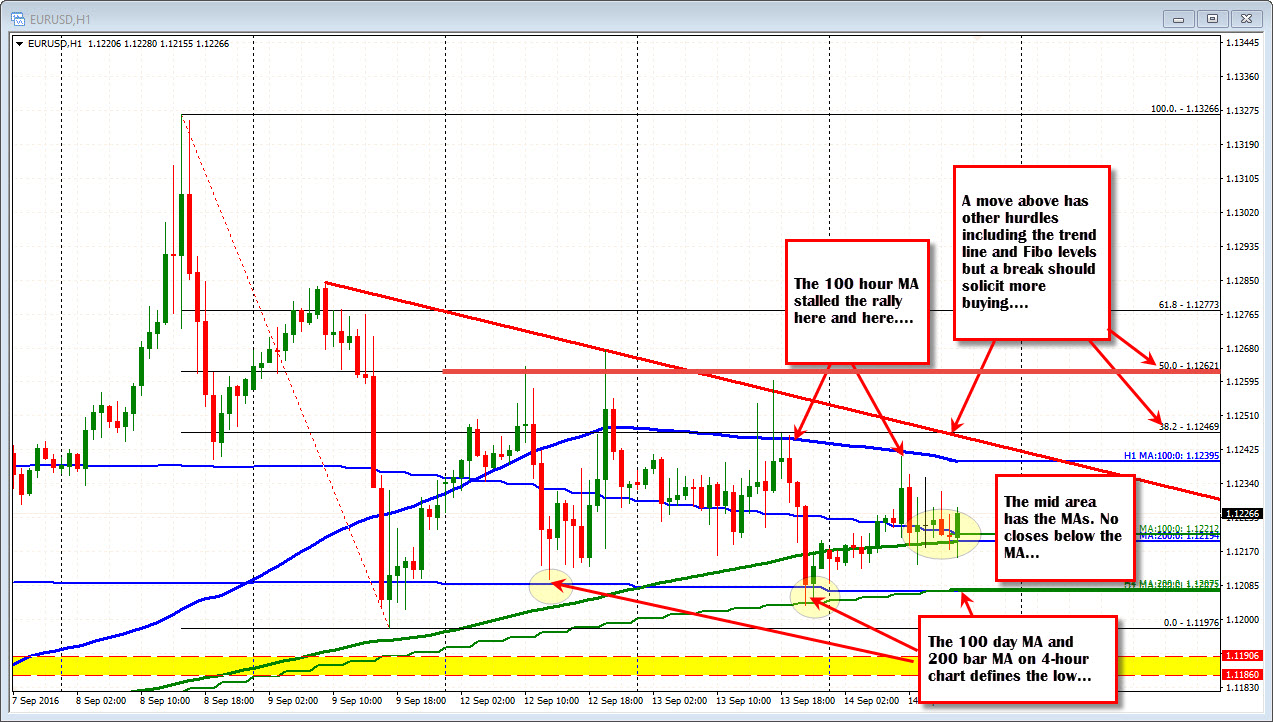
I have overlaid 100 and 200 hour MAs on the hourly and the 4-hour chart (Blue and green lines marked H1 and H4). I have overlaid the 100 day MA. A retracement of the last move lower from the Sept 8 high to the Sept 9 low and a trend line.
What can we see now?
Working backwards:
1. As the market moved higher today, the price approached the 100 hour MA (blue line) and sellers leaned. Yesterday, they had two failed runs above that line (should have continued higher but it failed). The final two tests of the MA found sellers at the level. Traders took that clue and sold against the line today. The last three tests held. Key level above.
2. Also of note in the last 24 hours is at the low from yesterday. The 200 bar MA on the 4 hour chart (green step line H4), stalled the fall. Also near that level is the blue 100 day MA line. Today both those lines are at the same level (give or take a fraction of a pip). Going back to Monday's trading the 100 day MA (blue line) also held support. So a key level below
So what we know from 1 and 2 is that there are sellers at 1.1239 and buyers at 1.12075. That is a narrow 32 pip trading range. At some point we will break out of that confined area and go somewhere else. Unless of course you think 32 pip range will make traders satisfied and wealthy. I don't think so.
What about in between those levels?
The 200 hour MA (green smooth line) and the 100 bar MA on the 4-hour chart sit near each other at 1.1219-21. The market price has moved above and below those lines over the last 6-hours, with no closes below the lower line. That may be a barometer for a more bullish bias. Sellers have to prove they can take and close below the MA lines. In other words, risk can be defined against those levels and the buyers are showing me more. It's not much, but it is more.
Also of note is that the longer the market non-trends the better chance for a trend-like move (heck 60-70 pips is trend-like in a 30 pip range). The range today is 32 pips. London traders are looking to go home soon. Does it have a move in it left for the day? Sure... Why not...
In a chop, you can often make some sense of it where risk can be defined and break levels can be refined and defined. Don't complicate things. Just tell yourself what you see and hope the market agrees.

