Up and down activity around 100 day MA
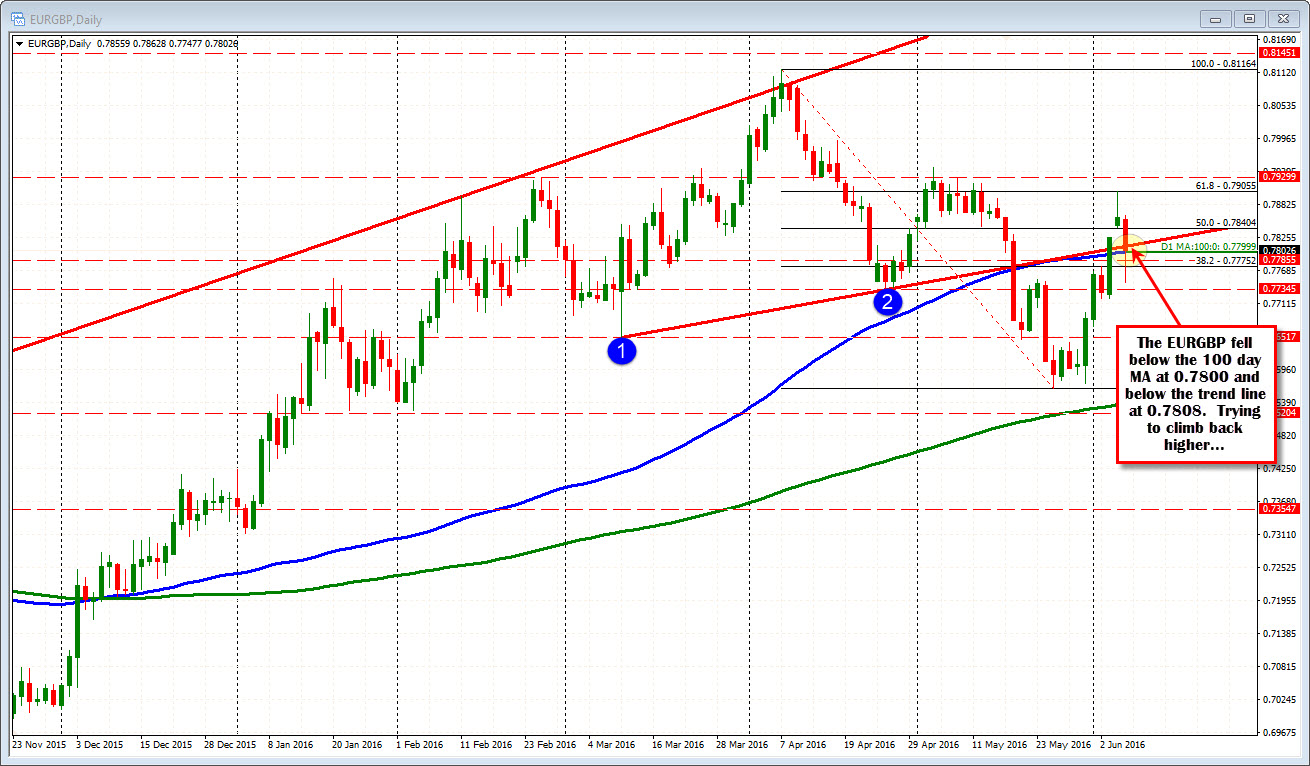
The EURGBP tumbled below its trend line and 100 day MA when the GBPUSD spiked 200 pips out of nowhere in the Asian Pacific session. The price rebounded but then fell again and has been trading above and below the 100 day MA at 0.7800.
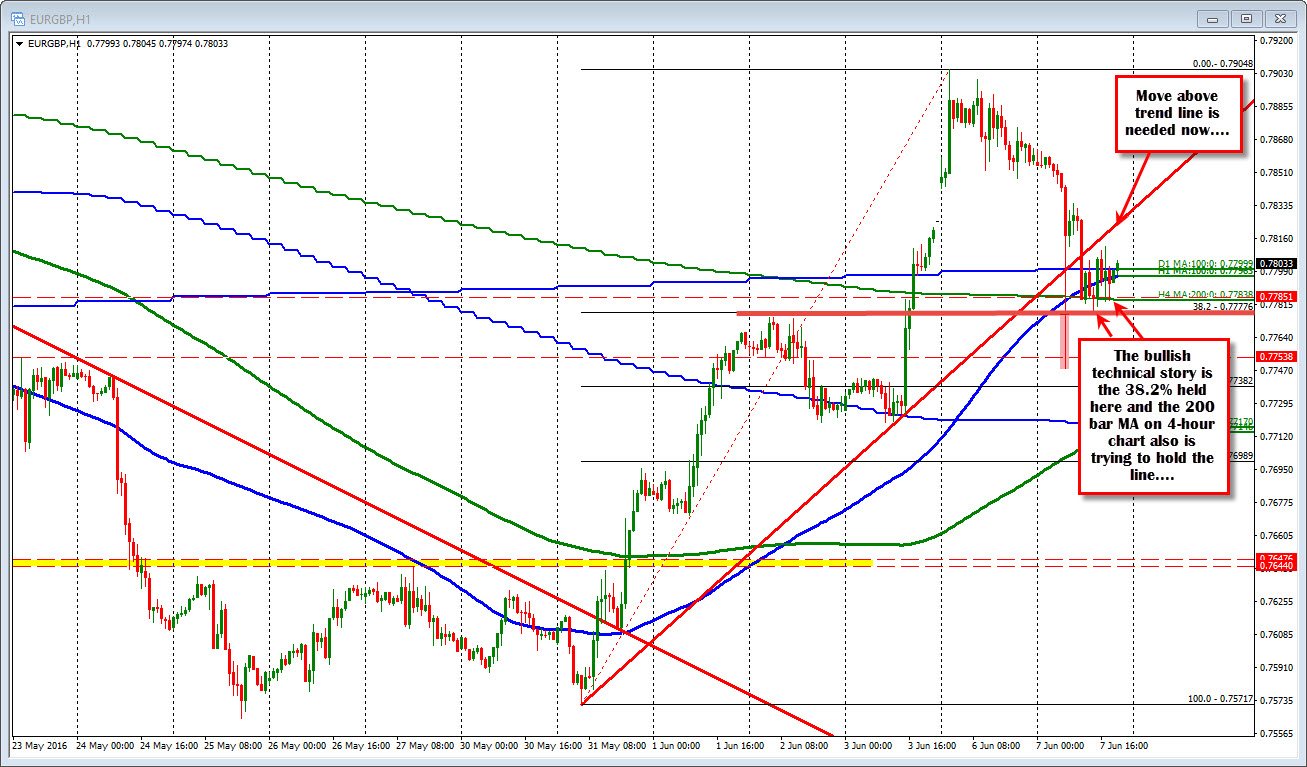
Drilling down to the hourly chart, the price action over the last 10 hours is up and down. IN the process, the pair has moved above and below MA levels In addition to the 100 day MA, the 200 bar MA on the 4 hour chart cuts across at 0.77838. The 100 hour MA is at 0.7798. The price is now above those MA levels - again. The bullish technical story is the 38.2% held support (discounting the tumble lower during the Asian Pacific session), and the 200 bar MA on the 4-hour chart also has been holding support (see chart below).