Price action down but technical support stalls the fall
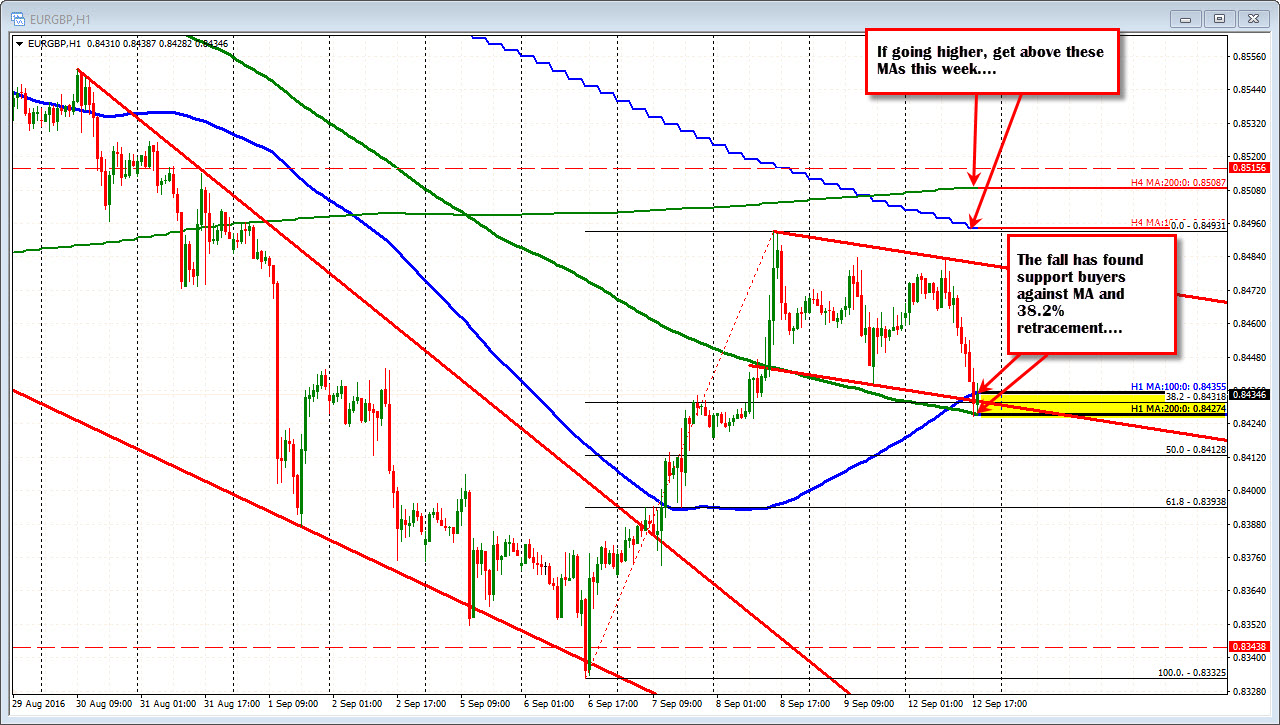
The EURGBP has seen the price move lower in the London trading session after a modest rally in the Asian Pacific session. The price decline has seen the price move from a high of around 0.8484 to a low of 0.8427. That low however, has stalled the fall right at the 200 hour MA (green line in the chart below). That MA comes in at 0.84272 currently. The pair also has support from the 38.2% retracement at 0.84318 and the 100 hour MA at 0.84362.
The area between 0.8427-36 becomes a key area for traders. Hold and move back above the 0.8436 level and the move lower is corrective. Move below the 200 hour MA and traders will be questioning the move higher from last weeks trading.
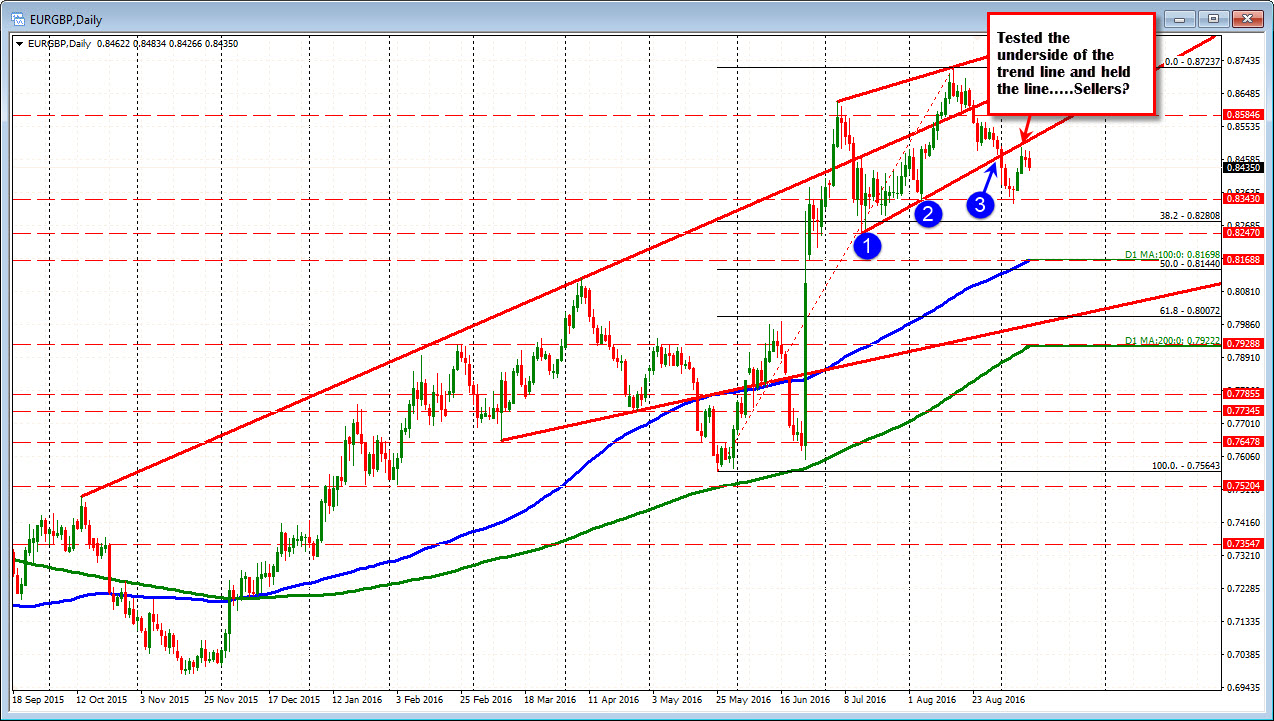
Taking a look at the daily chart shows the importance of the decision.
The trend off the chart (from left to right) is higher. However, trend lines have been broken over the last few weeks of trading. The move higher last week tested the underside of one of those broken trend lines. Staying below is a little more bearish. So if the low support can be taken out off the hourly chart, traders will be looking at an increasingly more bearish picture. It isn't necessarily rip roaring bearish but it is a little more evidence of the markets desire to sell (vs. buy).
Ultimately, the clue will come on the break of the aforementioned support. So far, the dip buyers are leaning and winning (a little) today.