We've been here before but new breaks give potential for new hope...
SPECIAL REQUEST from Rocco: ""What do u think the EURCAD...?"

The EURCAD moved above the 200 hour MA (green line in the chart above) on the back of the weaker than expected GDP, and has - so far at least - been able to stay above on corrections lower. The 200 hour MA comes in at 1.41657 currently.
Yesterday and on Friday, the 200 hour MA stalled rallies (see blue circle 1 and 2). That pattern gives buyers something to now lean against - what was resistance now becomes support. So buyers are trying to take control.
Now, the pair has moved above the 200 hour MA in the past. In fact, this is the 4th time in the last 9 trading days the MA has been crossed. The three others failed.
Nevertheless, you have to give the buyers the benefit of the doubt on the break (risk is around the 200 hour MA). The next target is the 50% at the 1.4220, then 1.42587 and those swing high fails at the 1.4275-79 area.
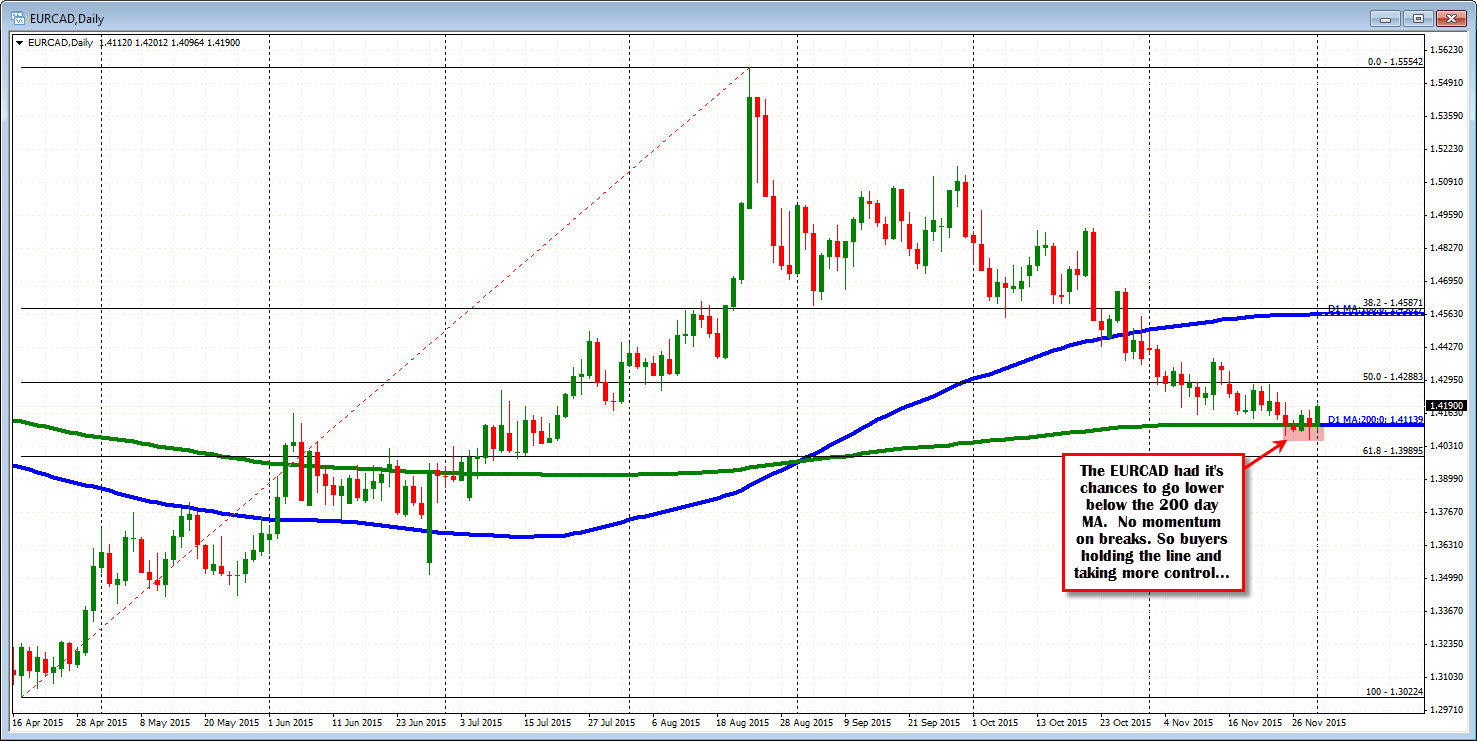
Taking a broader view, the daily chart below, shows that the lows over the last 5 days have breached below the 200 day MA (green line at the 1.41139). There was a close below on Thursday. That break failed. Wednesday and yesterday closed right near the levels.
The move higher today - and above the 200 hour MA (at 1.4165) - when taken in context of this chart (i.e., holding key 200 day MA support), shows buyers have something going. Bias more bullish above the 200 hour MA now. The low may be in place if that support MA can hold support.