A close below 200 day MA at 0.72575 would be more bearish.
The AUDUSD tumbled lower after the more the hawkish FOMC meeting minutes. The move has now taken the price below the 200 day MA at the 0.72575 level. The pair opened the trading week below the 200 day MA but rebounded. It has not closed below the MA since March 1, 2016.

The next target on the downside comes in at the 0.72114 level. This is the 61.8% of the 2016 trading range.
Back on May 3rd, the RBA cut rates from 2.00% to 1.75%. That sent the AUDUSD down from 0.7717 to a low that day at 0.74819. The pair has moved an additional 250 or so pips since that day - with a more steady trajectory lower. Yesterday, the 200 hour MA caught up with the price on the corrective move higher and the price traded above the 200 hour MA on two separate occassion (see green line in the chart below). Today the price moved back below the 100 hour MA (blue line) and tested that line right before release.
The breaking of the 200 day MA adds another negative technical element.
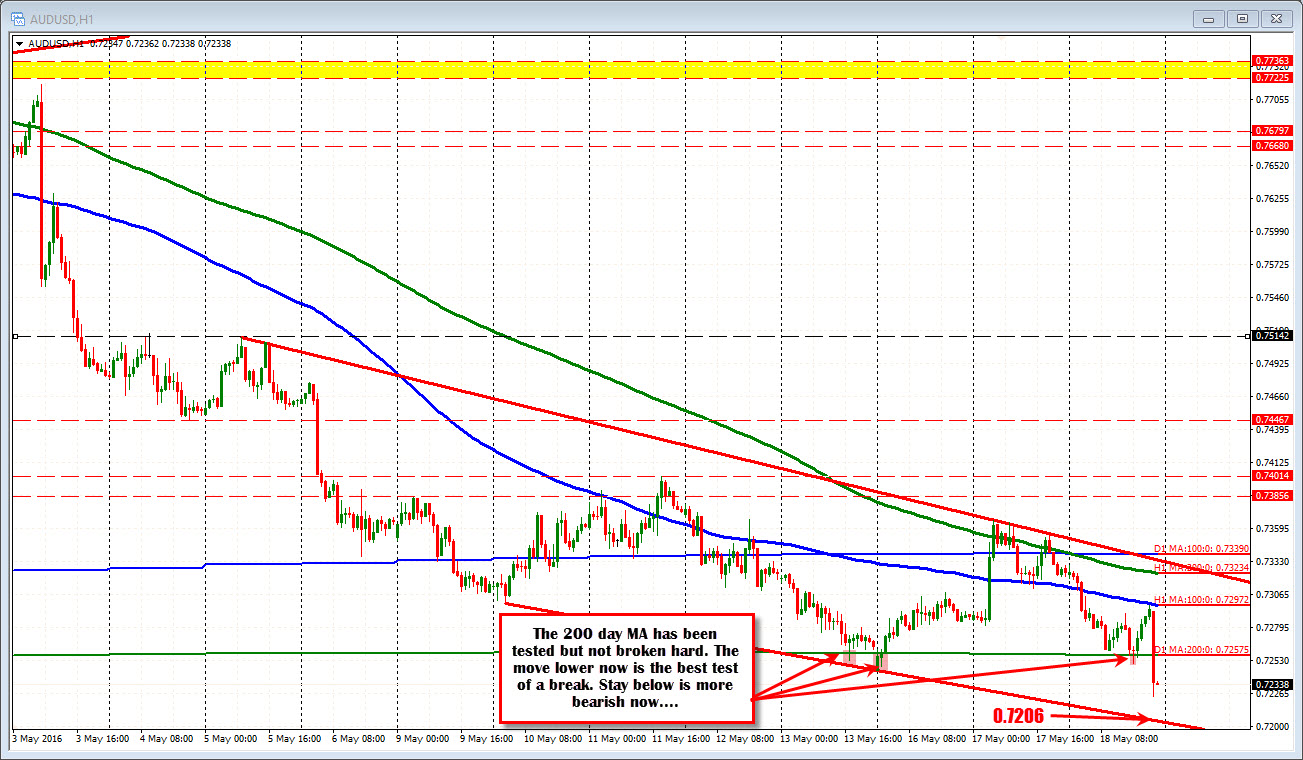
Risk is the MA line for shorts now. Looking at the hourly chart the 0.7206 is a trend line support. It matches up nicely with the 61.8% at 0.7211. That area should give cause for pause but the breaking of the 200 day MA is a big deal....