
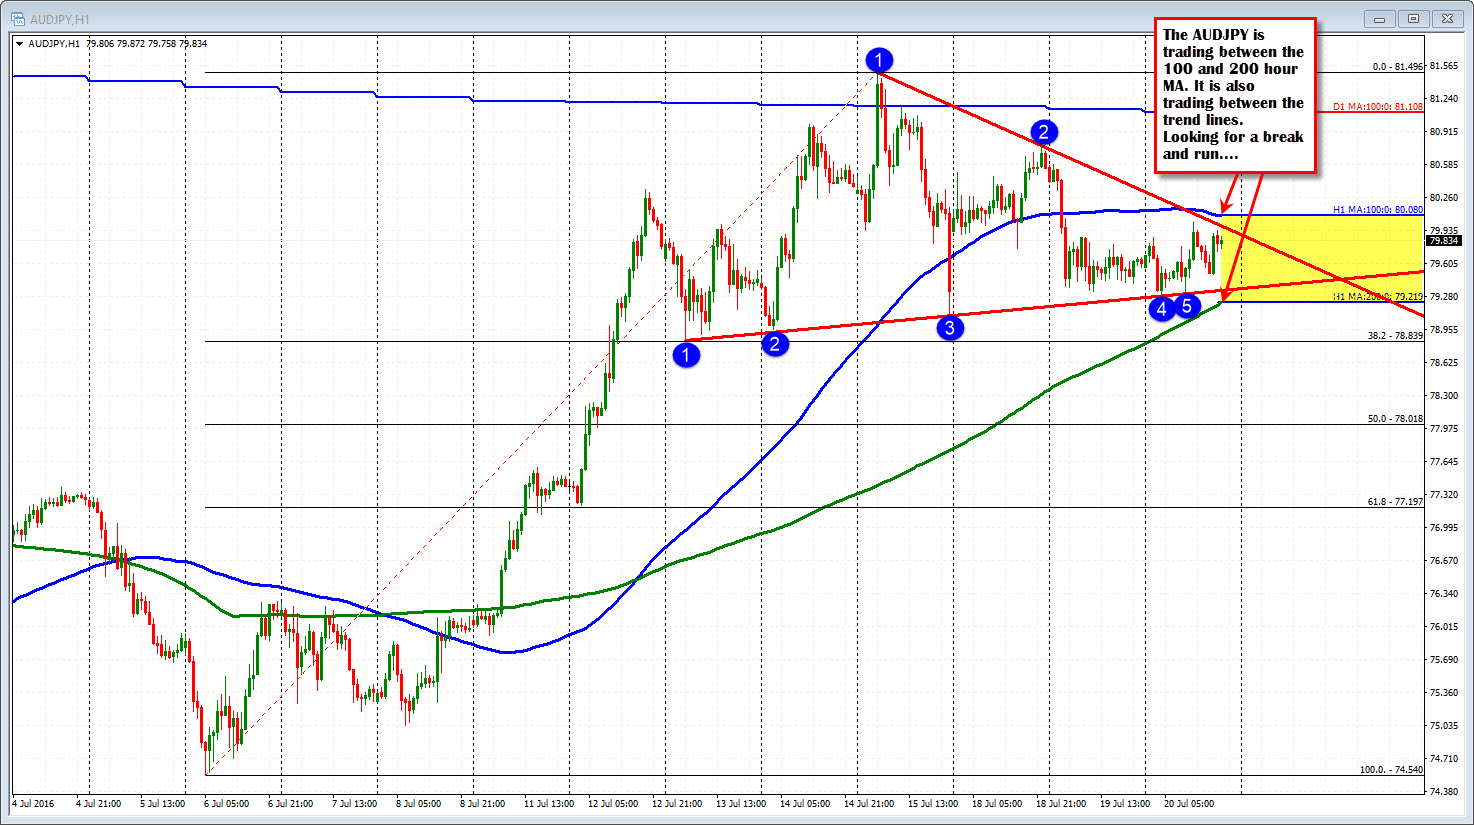
Trend lines and MAs confine the range
The AUDJPY has been consolidating between some pretty good support below defined by trend line at 79.34 currently and the 200 hour MA at 79.219, and resistance defined by a topside trend line at 79.98 and 100 hour MA at 80.079.
Look for traders to trade the extremes in an attempt to bank some pips. However, they will also be looking to hop on the next move on a break of the extremes. In between it is more of a coin flip.
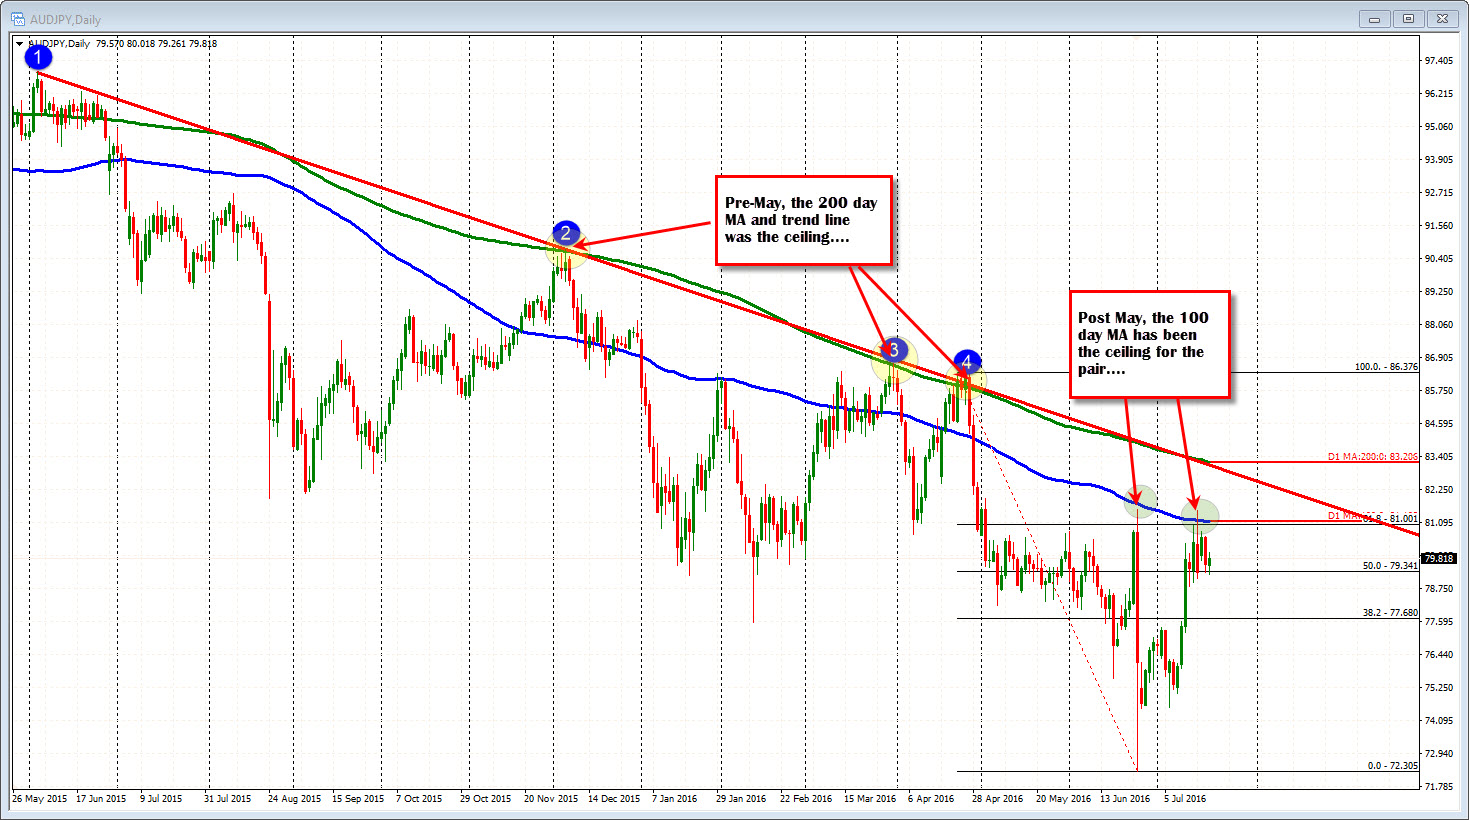
Looking at the daily chart, the pair - pre May - was trading with the 200 day MA (green line) and the topside trend line as the resistance.
Post-May, the 100 day MA (blue line) has been attracting sellers (in June and again in July). The 100 day MA comes in at around the 81.10 level now. That would be a target on a break to the upside. Needless to say, if the upside can be explored and the 100 day MA broken, the 200 day and the trend line will once again be eyed by the bulls.
The USDJPY is at key levels and that may be an influence going forward. The USDJPY is testing the 100 week MA at the 106.68. There is trend line resistance at 107.00-10 area. So there is a bit of a ceiling to get through. Having said that, oN the downside for the USDJPY, there is support at 106.23-43. Today we broke above that level and are staying above....
Battles between bulls and bears being fought.
Later today, the Australia NAB quarterly business confidence will be released. Last quarter it was at 4. In fact the last 3 quarters has been at 4. It has been positive since 4Q of 2013.

