
The trading is a bit random. Is there any technical clues for the pair
Looking at the EURUSD, the price action through the central bank decisions and now the US GDP release has created an up and down monster with an overall positive bias. Having said that, there are plenty of opportunity to lose money in the up and down swings that may not travel far (the by up and down range over the last 7 hours has been about 30 pips). If you like that kind of market, you are having a field day selling the high and buying the low.
Are there any other technical clues that traders can latch on giving what I see in the charts other than sell near the high and buy near the low (over the last 7 hours at least).
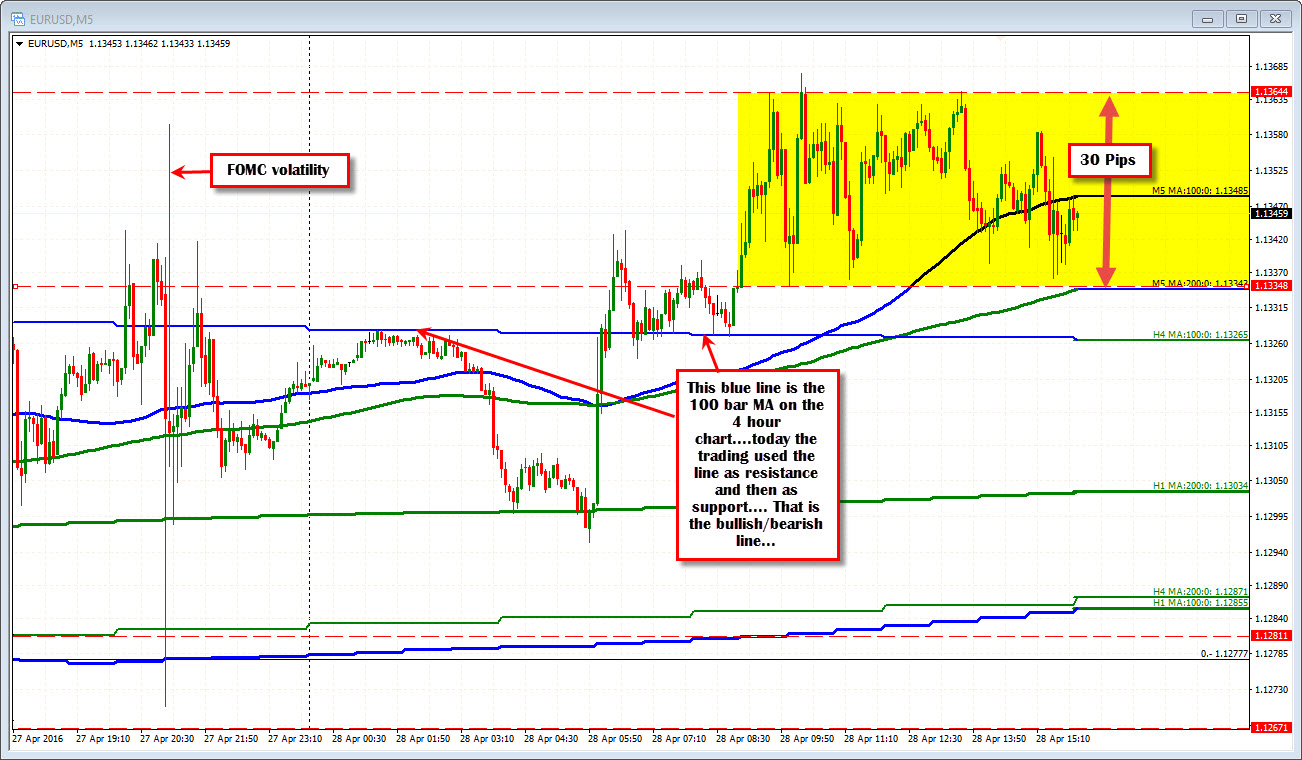
If you look at the 5 minute chart above, I have included the 100 bar MA on the 4-hour chart as an overlaid line. That is the blue step line currently at 1.13265. Note the price action today against that line. Earlier in the day, during the Asian Pacific session, traders used the level as a ceiling. The price fell.
Later toward the middle of the current day (so far at least), the price moved above that MA line and for the most part, started to use the line as support (give or take a pip or two as the price consolidated). The price eventually pushed higher and the 30 pip trading range started.
We as traders need to try and sleuth our way around the markets (we can also not trade if we don't like the price action). It often pays to keep things simple. Trade what you see. So keeping things simple folks, the range is the range. I see that. I mark it in yellow. There is a ceiling. That ceiling needs to be broken and stay broken. On the down side, the floor is there but so is the 100 bar MA line on the 4-hour chart at the 1.13265 level. Stay above...bullish. Move below bearish.
That is what I see today.....

