
Up 0.3% for the quarter.
Today is quarter end for the EURUSD. How did the quarter shake out?
- The pair closed the 2nd quarter at 1.1135. The current price at 1.1165 is a mere 30 pip change for the quarter. Let's call it unchanged
- The high reached 1.1711 on the infamous Dow down 1000 day (August 24).
- The low extended to 1.0807. This low took out the May low of 1.0818 by a mere 11 pips. No follow-through selling on the break ultimately led to buyers coming back in.
- The low to high trading range of 904 pips is the lowest range this year. The 1st quarter had an oversized 1610 pip range. The 2nd quarter was 945 pips.
- The % change for the month at 1.1170 is only +0.3%. The 1st quarter was a free fall quarter that saw the EURUSD fall by -11.3%. The 2nd quarter had a 3.8% bounce back gain
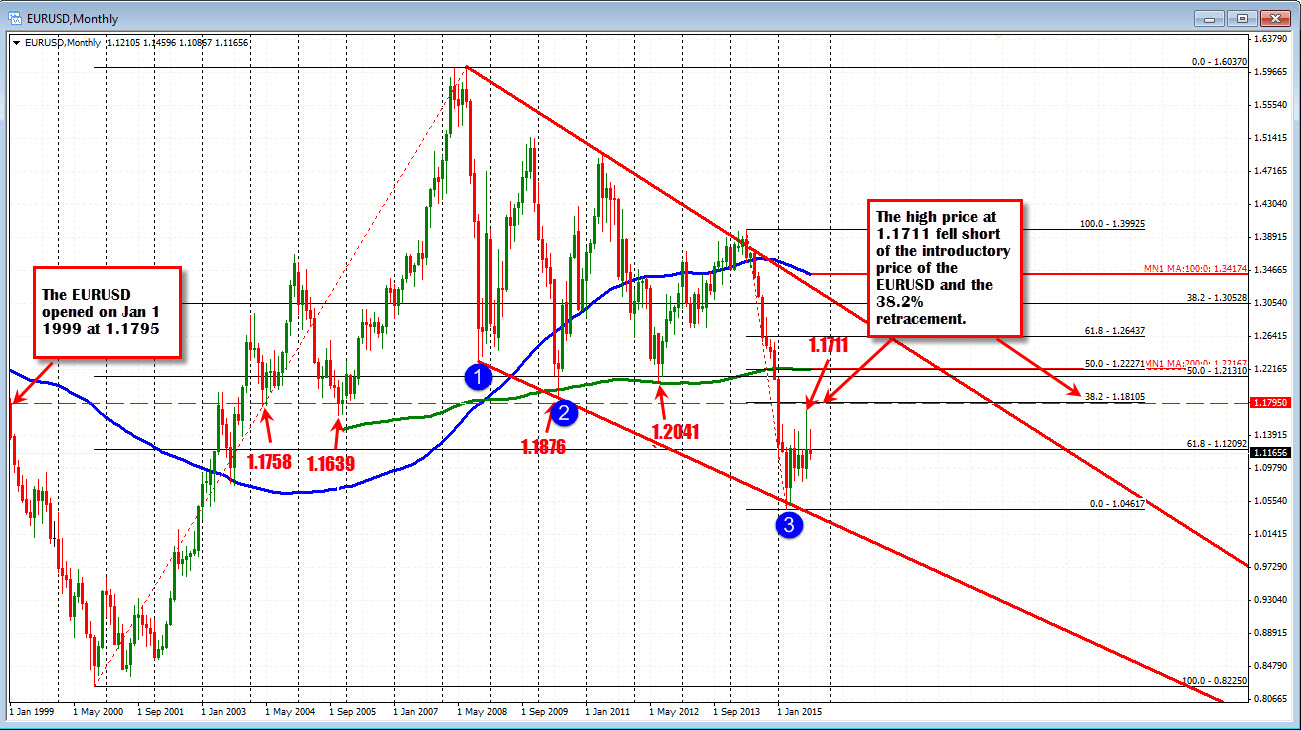
- The EURUSD peak of 1.1711 got within 100 pips of the 38.2% of the move down from the 2014 high at the 1.18105. It also came close to the opening introductory price of the EURUSD going back to Jan 1, 1999 at 1.1795. This area (between 1.1795 and 1.18105) will likely be a tough nut to crack on any rallies between now and the end of the year.
- The low for the year moved below the lower trend line but rejected, that break and the price rebounded. The lower trend line will start the new quarter at around 1.0400.
- The midpoint between the March low and the August high comes in at 1.10864. The low price for September came in at 1.1086 on September 3, 2015.
Overall for the quarter...little change but plenty of up and down volatility.
What does the technical picture look for the 4th quarter?
First off, the lowest quarterly trading range for the EURUSD going back 2007 was 490 pips - let's call it 500 pips. The most narrow trading range for any quarter going back to 1999 introduction has been 416 pips. If we can assume there is at least 500 pips in the EURUSD in the Q4, where will that 500 pips take us?
is
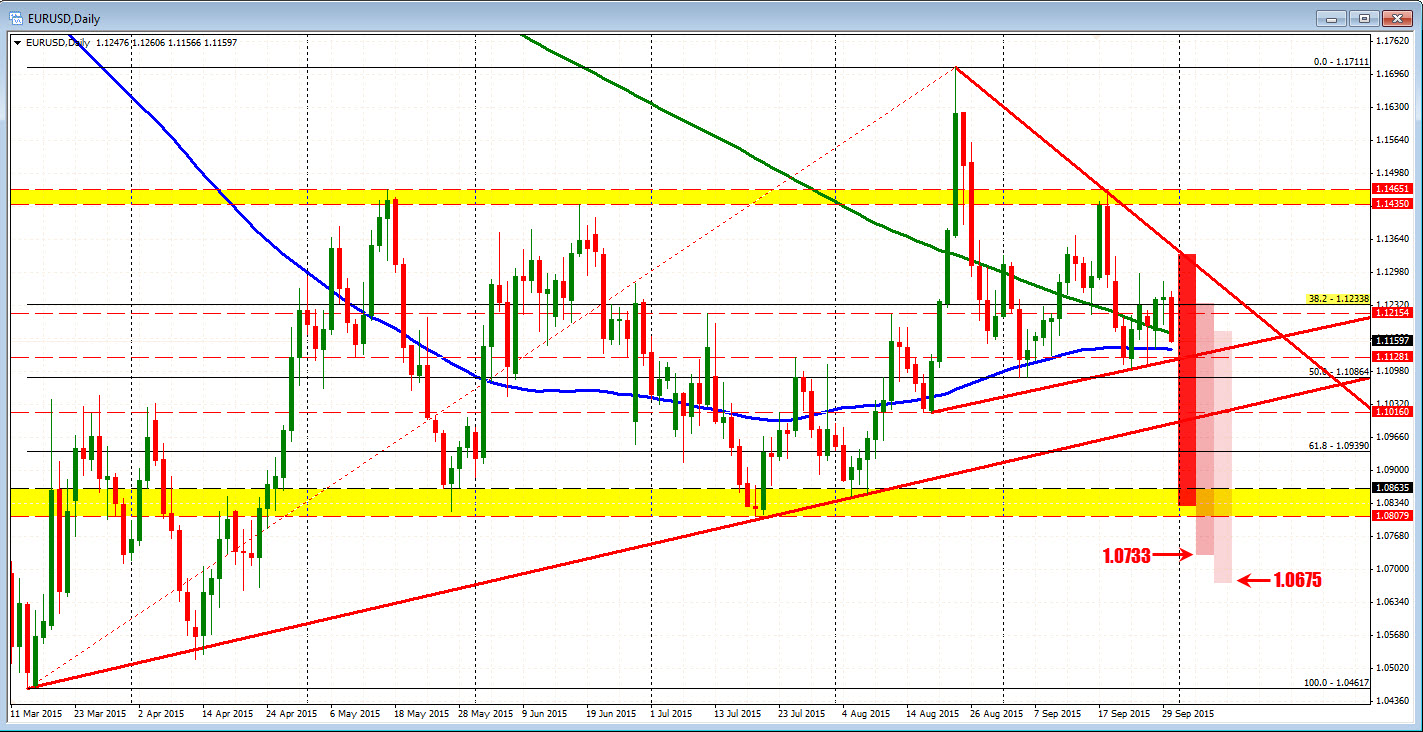
BEARISH MOVE: Looking at the daily chart above the pair has positioned itself between a converging 100 and 200 day MA (blue and green line) at 1.1144 and 1.1176 respectively. The convergence of those two moving averages with the price suggest that the market will be anxious to trend away.
I call this technical dynamic Threes a Crowd (2 MA and 1 price) and it signals a market that is unsure of direction. Eventually "the market" decides and it moves away. What is the "it" that moves away? The price leaves the two moving averages behind. The 4th quarter is shaping up as a quarter for potential move away.
If the trend is lower, a lower trend line at 1.1126 and the 50% of the move up from the March low at 1.1086 are key levels to get to and through for a more bearish bias. A move in that direction, could/should get a trend-like move going to the downside for the pair. With employment coming up, and the Fed once again threatening to pull the trigger, a stronger number might be the push the dollar needs.
Can that trend move lead to a directional quarter instead of the up and down one seen in the 3rd quarter? Where could it go?
The daily chart above has three 500 pip shaded bars to the side of the current price bars. Why 500 pips? That is the minimal the pair should move in the 4th quarter.
The first darker red bar assumes a peak against the topside trend line. A 500 pip trend move from that peak would take the price to the lows seen in May, July and August between 1.0807 and 1.0863.
The middle bar which peaks at the broken 38.2% of the move up from the March low (at 1.12338) would extend down to 1.07338.
The final bar assumes the price is ready to go lower and a stronger employment report on Friday starts the process. That move would target 1.0675. Once again that is assuming a minimal 500 pip move.
BULLISH MOVE: What happens if the move is more bullish on the back of weakening employment, falling global stocks, increasing global uncertainty.
The 500 pip up moves might look like this:
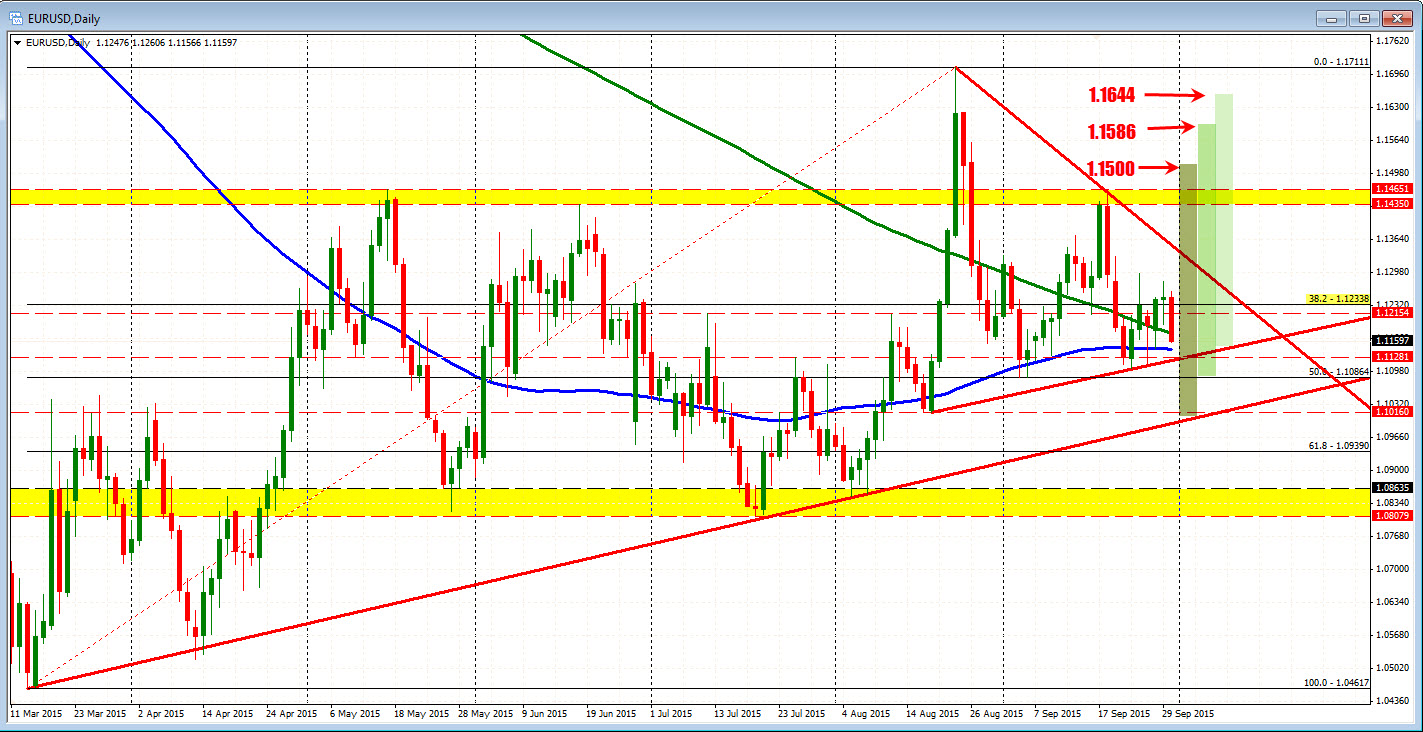
A down and up move might look to base near the lower trend line. A 500 pips move over the quarter would look toward the 1.1500 area. The second scenario might base near the 50% of the range since March and move to 1.1586. The third scenario would base near the 100 day MA and move up toward the August highs (well 1.1644). Again this is the minimum. Remember the 1.1795 to 1.1810 "tough nut to crack".
Knowing what is a minimal objective is a way to better see and anticipate the future. If there is a trend move away from the converged MAs in the 4th quarter, that move might get its push on Friday with the employment report. Be aware. Understand the implications of a trend move. Have some benchmarks in mind and it might help clear your mind to think more clearly in the 4th quarter.
What could derail any trend move? A wobbly stock market, a China syndrome, a Fed that keeps on confusing with their attempts to be transparent.
PS. Recent low to high ranges for the 4Q
- 2014 - 785 pips
- 2013 - 595 pips
- 2012 - 646 pips
- 2011 - 1388 pips
- 2010 - 1313 pips
- 2009 - 927 pips
- 2008 - 2390 pips
- 2007 - 952 pips
- 2006 - 887 pips
- 2005 - 568 pips
- 2004 - 1446 pips
- 2003 - 1278 pips
- 2002 - 821 pips
- 2001 - 515 pips
- 2000 - 1208 pips
So 500 pips is a minimum to anticipate.

