
The next key upside target comes in at 1.1053 area
The EURUSD made a quick run towards the 200 day moving average at the 1.10534 level. The high just extended to 1.10438 and has found early sellers against the key MA area.. The price is trading back down at the 1.1020 area in volatile trading.
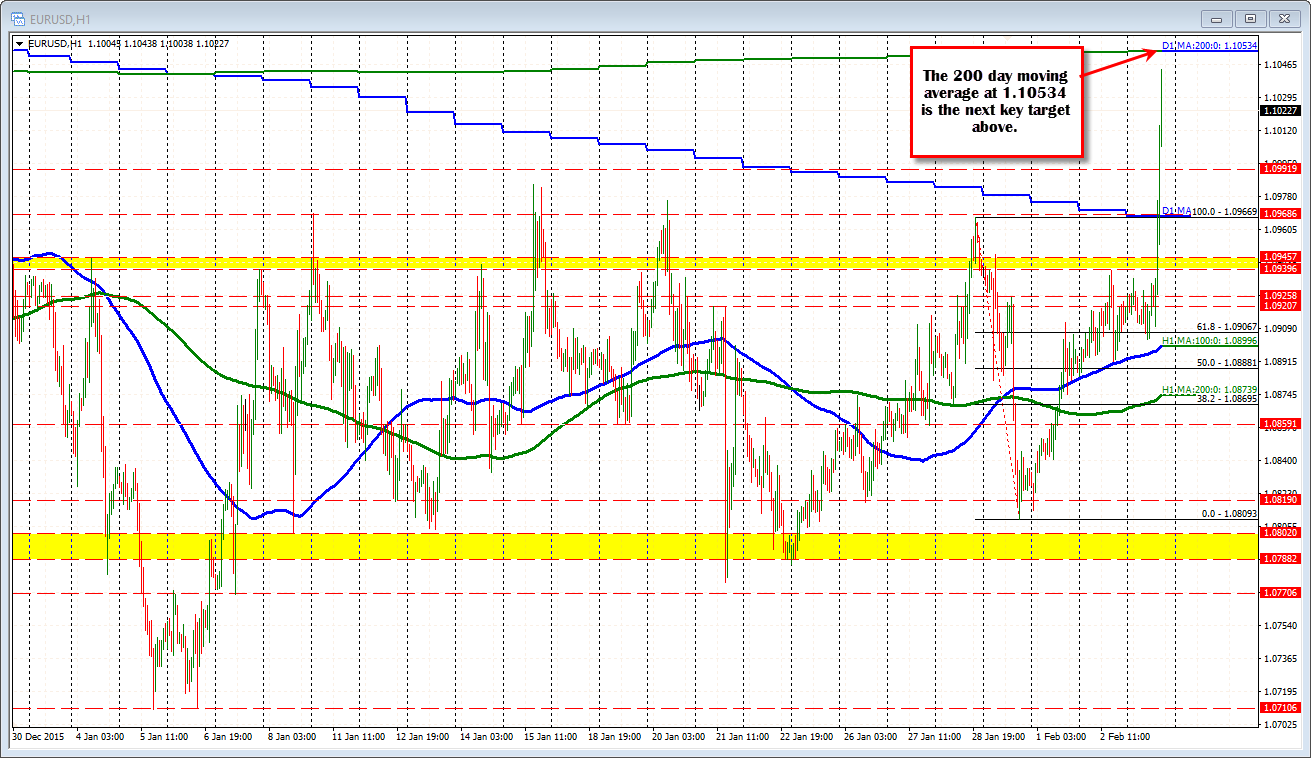
Earlier the 100 day moving average (blue line on the daily chart below) was broken at the 1.09669 (first time above since October 22, 2015). The 100 day MA was broken earlier this morning after the Dudley comments at the 1.09669 level (see blue line in the chart below)
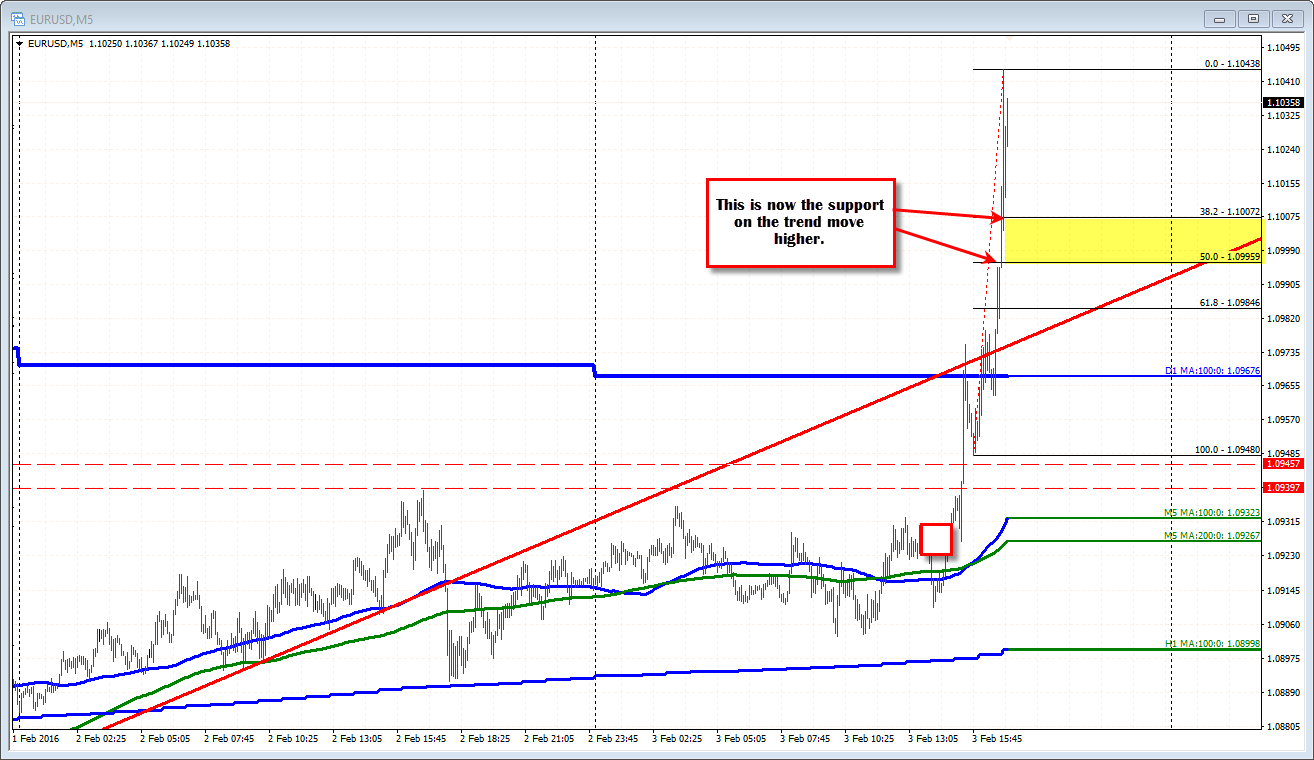
Looking at the 5-minute chart, the support will now look toward the 1.0995-1.1007 area. This is the 38.2-50% of the trend move higher so far (see the 5-minute chart below). If this is the BIG BREAK, I would expect to see the dips bought.
Needless to say, the market was looking for a break and run in the EURUSD. The month of January was the lowest trading range going back to November 2014. The pair had tried to get above and stay above the 1.0939-45 area (see top yellow area on the hourly chart), with little success until today (I think it is safe). NOTE, the 100 Hour MA held support yesterday. Today that MA was not really tested (see blue smooth line on the hourly chart).
Going forward, the 200 day MA at 1.10535 will be a challenge. Looking at the daily chart the 200 day MA and a topside trend line converge at the same level.
Keep an eye on corrective buying on dips to see if the pair backfills and moves from there...


