
EURUSD survived knocking around and old level
1.0880 was a level I highlighted yesterday before the ECB meeting. It was a level that had seen a lot of action last year and while it lost its shine towards the end of 2015, it still struck a cord in the old brain box as we crept back towards 1.0900.
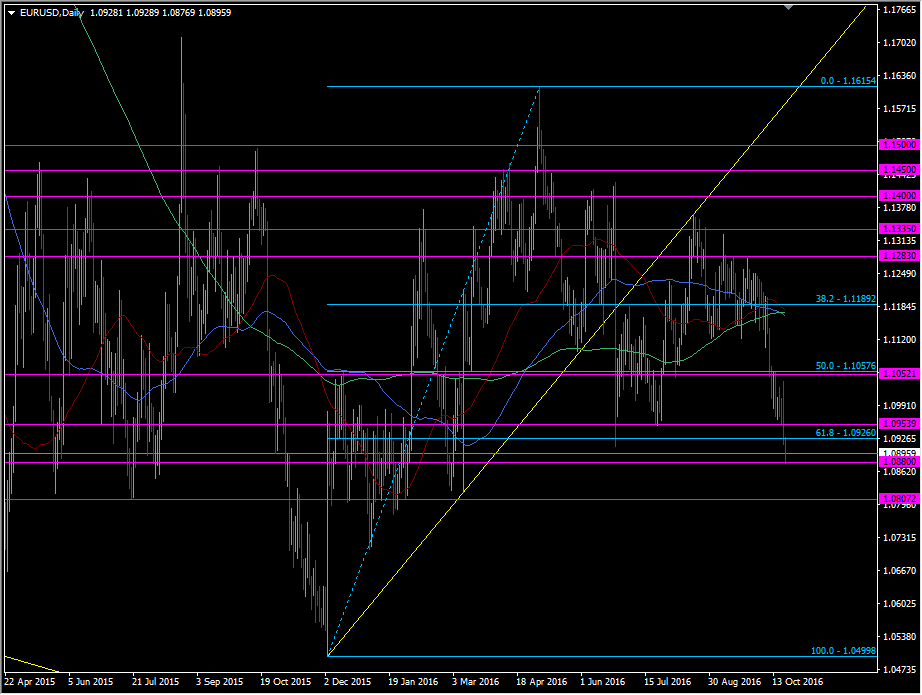
EURUSD daily chart
And what do you know, it's in play again. I had no idea whether it would show up as a level again, so much so that I had taken off the horizontal line I had there a while back.
Why has it stopped there this time? Who knows? Maybe it's the bids there that Mike highlighted earlier. It's been noted that the interbank have some bids in there at 1.0875/80. Maybe other traders had a line drawn there on their charts.
The reasons don't really matter, what matters is learning to read price action can help you learn how a price may react now or in the future. Many people think charts tell them where a price is going. For me they're simply a record of where a price has been, and they tell me where something may happen. Something happened at 1.0880 before, and now something's happened there again.
How you use that info is up to you. You can use it to enter a trade or use it to get out when it fails to break. The more info you have the better your trading decisions will be. And for a little more info, the offers at 1.0950 have interbank trades involved and there's stops above 1.0960 now.

