Stalls at 100 bar MA on 4-hour chart
The fall in crude oil inventories has helped oil prices move up from around $36.80 to $37.50. (up 4.49% on the day). For the USDCAD it sent the price back down in what has been an up and down trading session (especially in the London session).
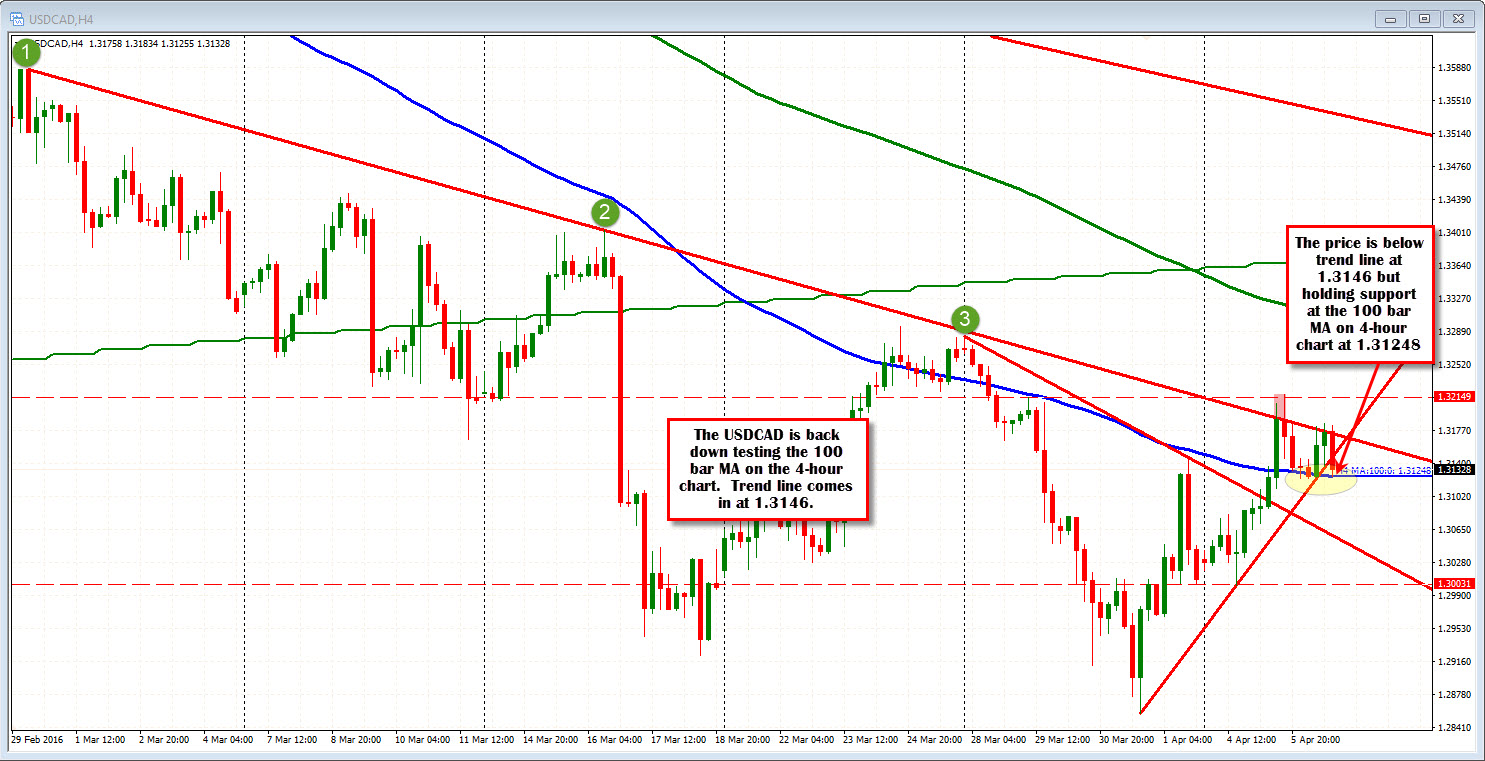
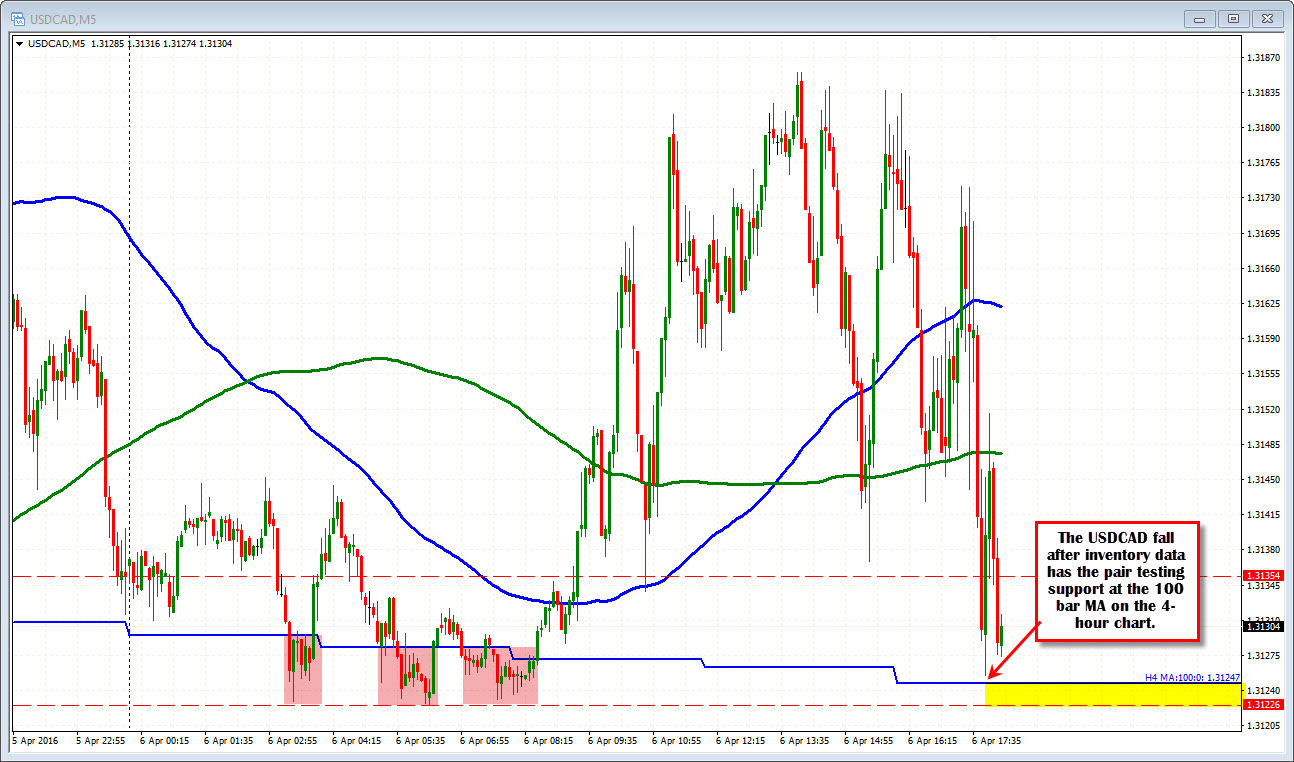
The move lower has taken the price back down to the 100 bar MA on the 4-hour chart (and near the closing level from yesterday at the 1.3135 level) , That MA line comes in at 1.31248.
Earlier today in the Far East session the price took three separate trips below that MA line (see red shaded areas)- with the largest break being 6 pips below. After the third failure, the up and down volatility kicked in (see 5-minute chart below). Lots of spike moves higher and tumbles lower.
Currently, the low for the day and the 100 bar MA level are on top of each other. A move below should solicit more selling (1.3100 is the 200 hour MA). Failure to do so, may lead to disappointment (it was just one number) and a reversal back higher. That has been the pattern. For the time being, the shorts are trying to hold onto the last downward move.....