
The $50 mark is in sight for both Brent and WTI
The oil report hasn't been enough to get longs running to the hills but it's put the brakes on for now.
WTI has managed to vault the Nov 2015 high at 48.30 and if it can crack 49.00, will be thinking about the big fat 50.
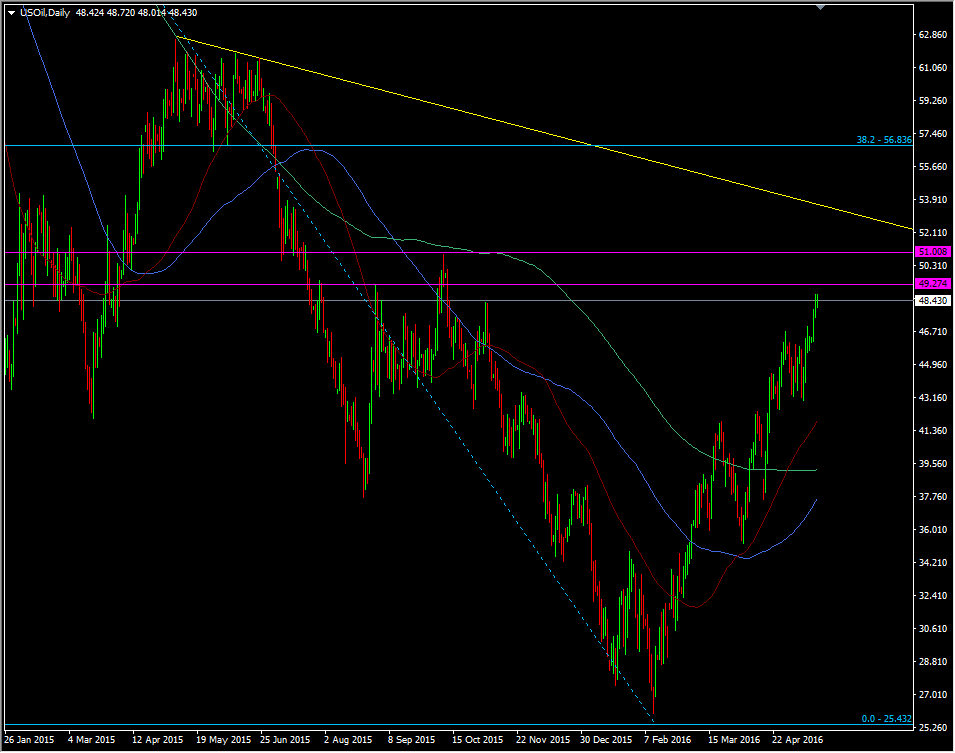
WTI daily chart
from 49.00 to 49.50 is where we'll run into further traffic before 50.00 and even a break there might struggle into 51.00.
Brent is closer to the number and has resistance through to 50.50
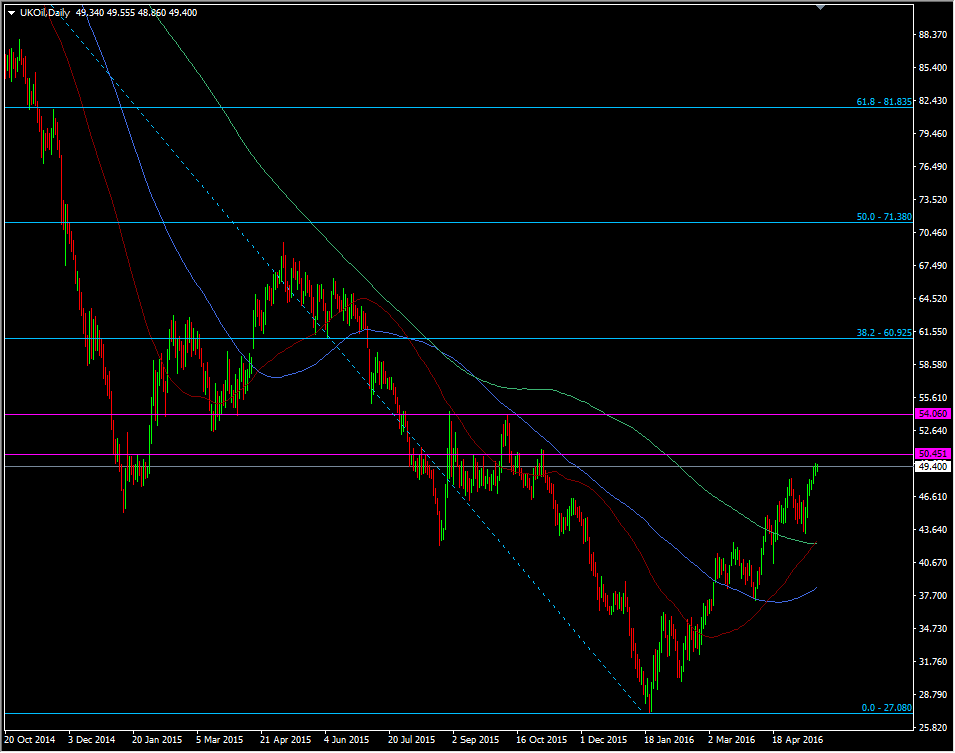
Brent daily chart
Both are still a fair way from their respective 38.2 retracements from the 2014 fall but prices are up nearly 100% from the Feb lows and that's not to be sniffed at.
Looking at the wider picture and the fibs, it shows how much work is still to be done, despite the move from Feb. It's surprising that there's so little selling pressure from producers who might want to take advantage of this move but then again, they might just want to chance their arm that it keeps on going.
Shorting is still the high risk trade right now unless we see some of the bigger resistance levels holding out.
BTW, for those that may not know, a bullseye is the centre of a dart board and worth 50 points. It's also used in the UK as slang for 50.

