
Up 0.20% on the day...
Yesterday I was asked to do an analysis on the NDX index. So here it is.
The US stock indices are higher in trading today. The NDX is a leader with a gain of 0.20%.
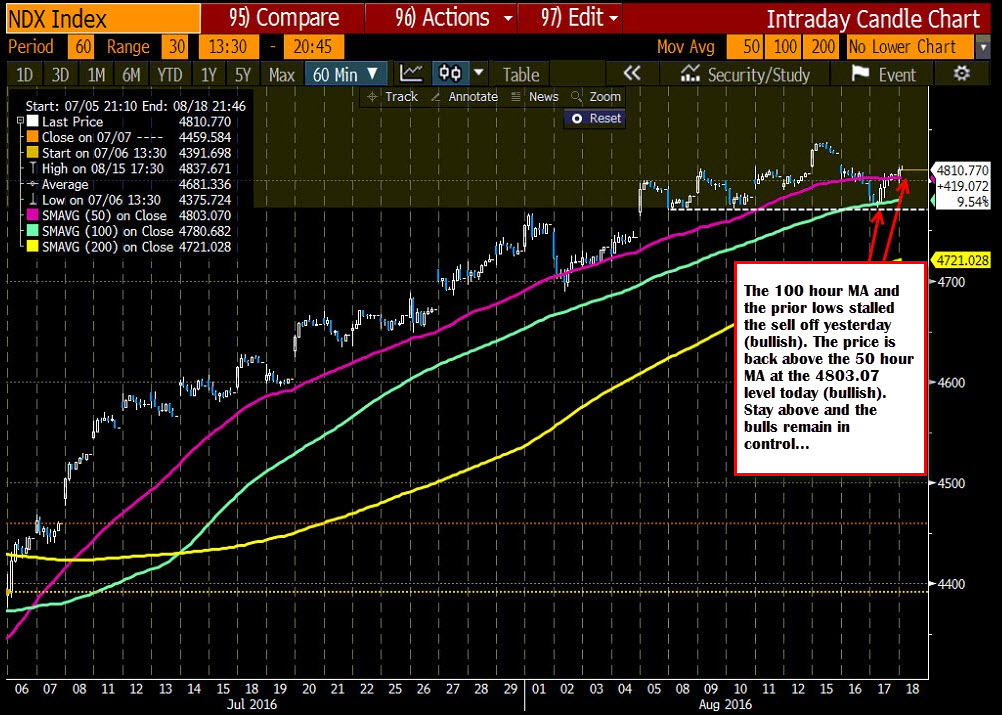
Technically, the pair trades above the 50 hour MA (currently at 4803.07 - see chart above). Looking back in time the index tends to lean against the MA line - defining risk/limiting risk in the process. Staying above will keep the bulls in charge today.
Also more bullish from the hourly chart is how the pair found support buyers against the 100 hour MA and the prior lows in yesterday's trading. The price dipped briefly below the MA line, but quickly found buyers and the move back to the upside was on. Buyers showed they still like the market.
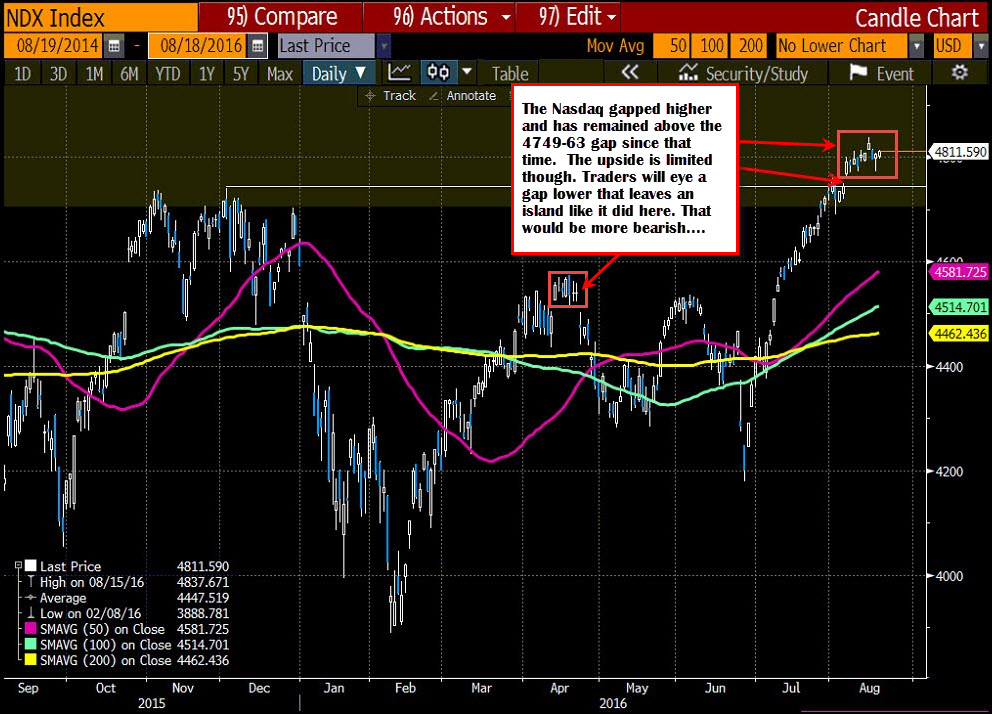
Taking a broader view, the daily chart shows a gap higher and the forming of a island. Now the price can continue higher (it is more bullish from the hourly chart), it can retrace and fill that gap. Another thing it could do, is gap lower one day and leave that island top. That would be more bearish (see chart below) if it were to happen. So be aware of the possibility
Overall, I like what I see technically. However, there are some caveats other than the MAs and leaving an island on a gap.
The 4816.35 was the old high from 2000. The high today has reached 4814.54. There may be a reluctance to move back above that benchmark level. If so. .... if the price action today can not get and stay above that level, it may be a signal of more selling to come. SO be aware.
Other targets above come in at 4827 (low gap level from Monday), and the 4837.67 new all time high.

