
The standard USD trade
2. USDJPY: Long or short
Reasons: The go to USD trade for anything US data related. If the price moves well outside of what I feel the data justifies. I'll look for a stretch point to fade.
Where to get in: Looking above and below
Above
- 107.40 was a level I highlighted last week as we came down to the lows. The chart is clear that it's a fairly strong resistance point. It may be too close to the price so I'll only look to touch it if the data is mild
- 108.00 is my preferred level that stands out. It was a support break level on the way down and it also marks the 38.2 fib of the 112.00 fall. The 200 H1 ma adds a bit more to the level. At roughly 110 pips away it's well within range for an NFP that's good but not game changing. We're likely to see a speed bump around 107.70 odd
- 108.20, 108.40/45 & 108.70 are spots to watch if 108.00 breaks but it will take something special to get up here. If that's the case I'm going to be less inclined to short at all.
Below
- Considering the bounce from the 105.50 low stinks of dead cat, I'm going to be cautious about where I look to buy down here. 106.00/20 is what I'd look at for a small long and one I'd possibly keep fairly tight on a mildly soft NFP. Again, it depends on where the price is at the time.
- 105.75 is the 200 MMA. We breached it but didn't stay below it for long. My only concern is that we went through it pretty easily the first time. I would consider buying there small and adding nearer this week's low
- The 105.50 & 105.00 levels look to be a strong ones. 105.50 was strong resistance back in 2013 and a level that threw the price back down towards 100.00. We had to wait until the end of Aug 2014 for the break. 105.00 then proved itself as break support around 105.20 in Oct 2014. The 200 WMA adds to support there at 105.07. These are the types of longer-term levels I like to trade anyway, irrespective of data noise so it's one I'm watching carefully
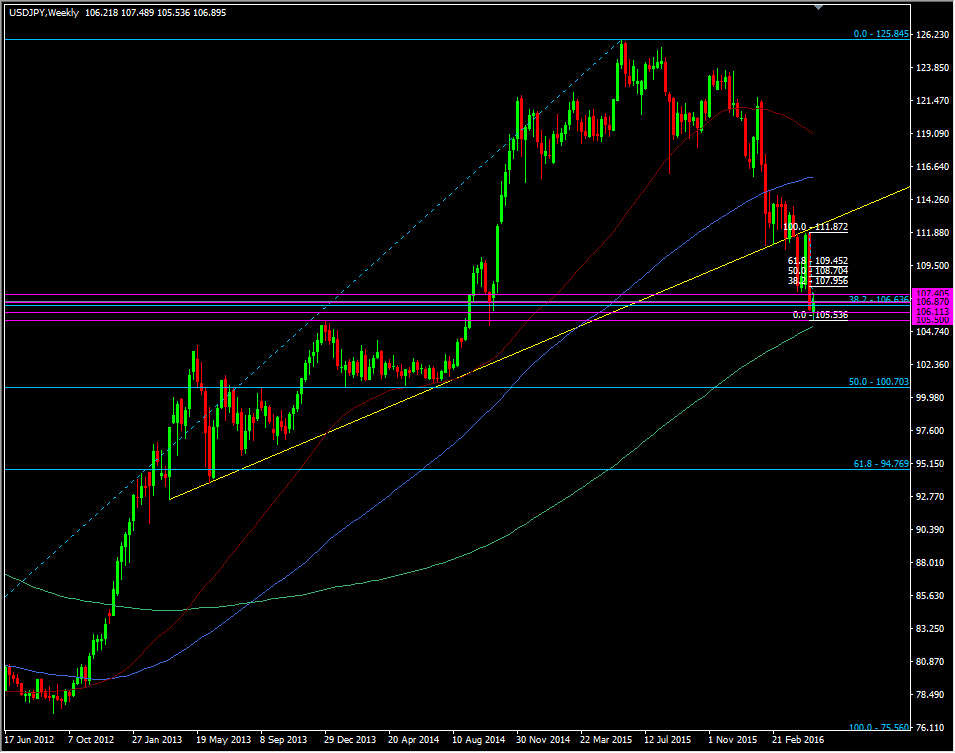
USDJPY weekly chart
Part 3 up next

