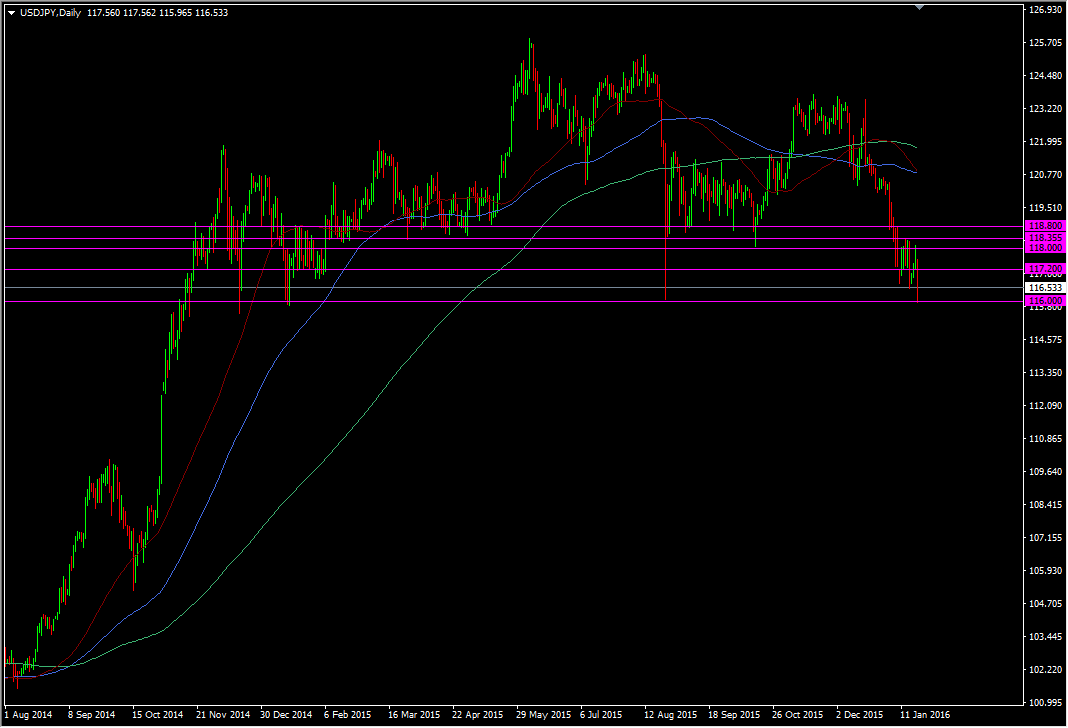
The 116 level has been a historical support and resistance point
Call up a weekly chart and you can track how often this level has had a says in the pair going all the way back through to 1998
It's been most notable since the break up through it in 2014

USDJPY daily chart
So far 2016 has been all bout breaking ranges. This pair properly broke out of the 118.00 range bottom that contained it through most of 2015. 116.00 is the final line for the wider range going back into 2014.
It's a biggie and one that could see an even bigger move to the downside. At the moment it seems to be clinging in to it by the skin of its teeth. Over the last few days the highs have got lower and so have the lows. Even this bounce today isn't looking too hot.
117.00 is building resistance now so we have a nice simple intraday range to play. As I type 116.50 is supporting the bounce from 116.00 so any longs from the low have a buffer for now
On price action alone I'm favouring a break, particularly if we slide back down there so soon after this bounce. On that basis I'm looking to short a break, if it happens, and I'll likely use somewhere just over 116.50 or 117.00 as my stop until I get confirmation that 116.00 is resistance. Longs from the level might still be a good play but they'll need to be kept on a tight lead.


